Adolescent life satisfaction and social media use: gender differences in an international dataset
Acknowledgments
The authors would like to thank Danny Blanchflower and Alex Bryson for productive discussions and the PISA dataset administrators for making their data publicly available.

Key insights
Although many studies have documented links between heavy social media use and poor mental health, fewer studies have explored associations with positive wellbeing, especially in international datasets.
In 2022, the OECD’s PISA survey, conducted in 47 countries, asked over 270,000 15- to 16-year-olds how many hours a day they spent using social media and how satisfied they were with their lives.
Among girls, mean life satisfaction was highest among light users of social media (less than an hour a day) and declined with further hours of use. Among boys, this pattern held only in Western Europe and English-speaking countries.
The mean differences obscure a notable pattern, especially among boys. Compared to light users, a larger percentage of the heaviest users (7+ hours a day) had both the highest level of life satisfaction (10) and the lowest levels (0–4). The same was true for non-users of social media, with higher levels of both very high and low life satisfaction.
Thus, there is more variation in life satisfaction among non-users and heavy users of social media compared to light or moderate users. Among girls in most regions, non-users of social media were the most likely to report complete satisfaction with their lives, although in some regions, heavy users were also more likely to report complete satisfaction than moderate users.
Introduction
Social media use is extremely common among teens around the world. An analysis of the international Health Behaviour in School-Aged Children (HBSC) study found that 78% of adolescents were active social media users.[1] On average, teens in the US use social media 4.8 hours a day, including Instagram, TikTok, and YouTube.[2]
Thus, it seems important to determine if social media use is associated with lower wellbeing. Although many studies have examined these associations, the size and importance of links between social media use and wellbeing are still debated in the field.[3] In addition, more studies have examined associations between social media use and negative outcomes, such as depression,[4] with fewer studies examining positive outcomes, such as happiness or life satisfaction.
Furthermore, most studies of adolescent social media use have been conducted on populations in the US, Canada, or the UK.[5] Studies examining adolescent social media use and psychological wellbeing in other countries and regions, especially from nationally representative samples, are scant, and even fewer have examined these associations across many regions using the same measures.
In 2022, the Programme for International Student Assessment (PISA) survey, which collects nationally representative samples of 15- to 16-year-olds in countries around the world, asked teens how much time they spent using social media each day. Students were also asked how satisfied they were with their lives, a common measure of positive psychological wellbeing. Thus, the 2022 PISA dataset makes it possible to examine associations between self-reported social media use and life satisfaction across many regions around the world using the same measures.
Most studies of adolescent social media use have been conducted on populations in the US, Canada, or the UK.
Method
Participants
Participants were students completing the OECD PISA survey, which obtains nationally representative samples of 15- to 16-year-olds enrolled in school in each country. Schools were required to have at least an 80% response rate for student participants. The survey was administered in the same language used for instruction in the school. We drew from the 2022 administration of the PISA dataset (maximum n = 270,096 for the items of interest).
Measure of social media use
Students were asked: “During a typical weekday, how much time do you spend doing the following leisure activities? … Browse social networks (e.g., Instagram, Facebook)”. Response choices were: no time at all (coded as none), less than one hour, between 1 and 3 hours a day (coded as 1–2 hours), more than 3 hours and up to 5 hours (coded as 3–4 hours), more than 5 hours and up to 7 hours (coded as 5–6 hours), and more than 7 hours a day. We focused on this item as the other item mentioning social media – “Communicate and share digital content on social networks or any communication platform (e.g., Facebook, Instagram, Twitter, emails, chat)” – also included platforms not usually considered social media (e.g., emails, chat).

Measure of life satisfaction
Students were asked: “Overall, how satisfied are you with your life as a whole these days?” with response choices ranging from 0 (not at all satisfied) to 10 (completely satisfied). We examined the means, as well as those low in life satisfaction (0 to 4) and very high in life satisfaction (10). These groupings were used as they came the closest to one standard deviation below and one standard deviation above the mean, a common cutoff for clinical issues across several types of scales.[6]
Grouping by region
The social media and life satisfaction questions were asked in 47 countries, which we grouped by cultural regions, as shown in Table 5.1.
| Asia | Brunei, Hong Kong SAR of China, Japan, Macau SAR of China, Malaysia, Republic of Korea, Taiwan Province of China, Thailand |
|---|---|
| Central and Eastern Europe | Albania, Bulgaria, Croatia, Czechia, Estonia, Georgia, Greece, Hungary, Kazakhstan, Latvia, Lithuania, Poland, Romania, Slovakia, Slovenia, Ukraine |
| English-speaking countries | Ireland, United Kingdom |
| Latin America | Argentina, Brazil, Chile, Costa Rica, Dominican Republic, Panama, Uruguay |
| Middle East & North Africa | Jordan, Morocco, Saudi Arabia, Türkiye |
| Western Europe | Austria, Denmark, Finland, Germany, Iceland, Italy, Malta, Spain, Sweden, Switzerland |
Results
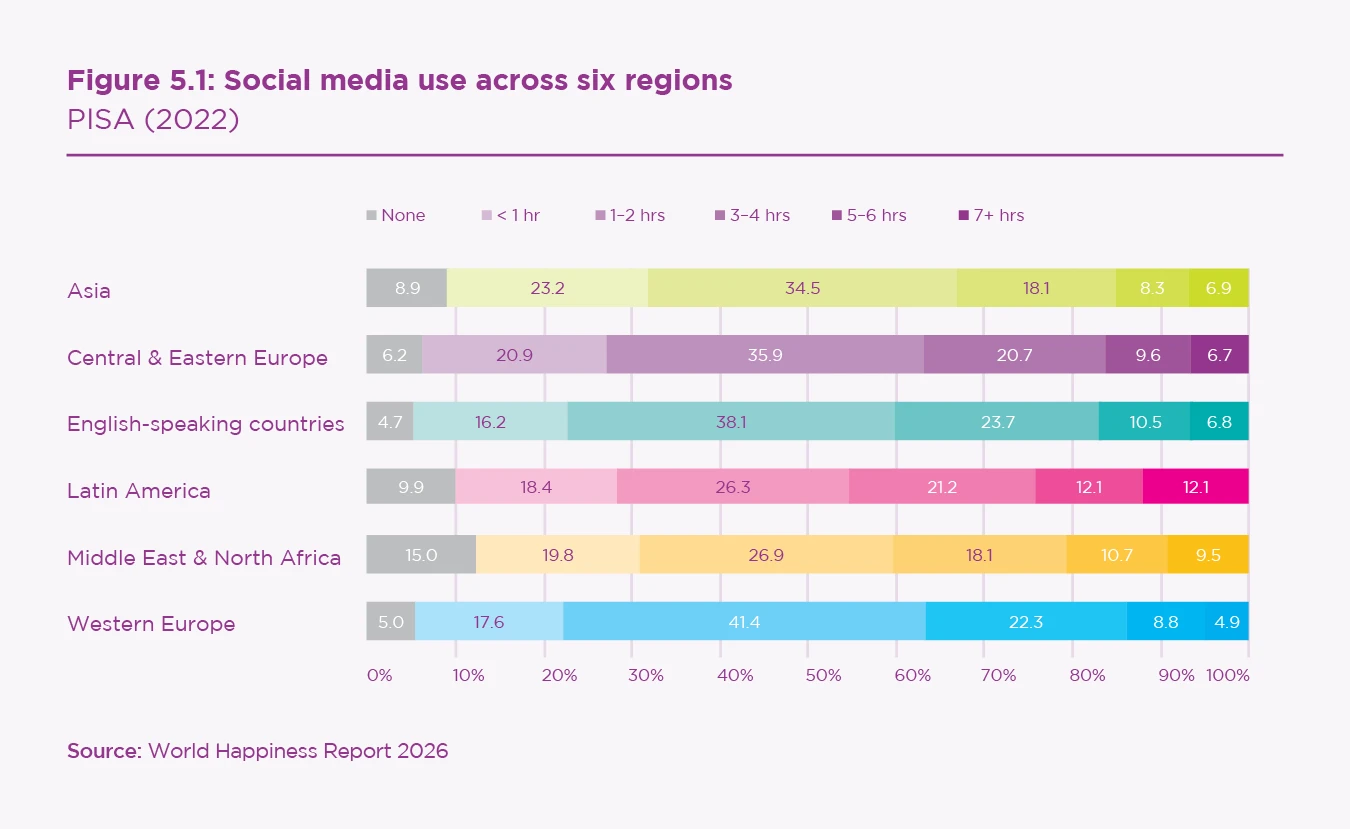
The distribution of time spent browsing social media networks is shown below in Figure 5.1. The results for each region are broadly similar, with the highest proportions of heavy users (five or more hours) in Latin America (24.2%) and the Middle East and North Africa (20.2%). In all regions, the majority of adolescents reported spending less than two hours browsing, but this may not include time spent watching videos on YouTube.
The associations between social media use and mean life satisfaction are shown in Table 5.2, separated by gender and region. Among girls worldwide, non-users and light users of social media were more satisfied with their lives than heavy users. Among boys, a different relationship was observed, with both light and heavy users reporting higher life satisfaction than non-users.
| None | <1 hr | 1-2 hrs | 3-4 hrs | 5-6 hrs | 7+ hrs | None vs. 7+ hrs d (95% CI) | <1 hr vs. 7+ hrs d (95% CI) | |
|---|---|---|---|---|---|---|---|---|
| Girls | ||||||||
| Worldwide (n = 144,346) | 6.40 (2.95) 5.7% | 6.71 (2.54) 16.8% | 6.64 (2.33) 36.2% | 6.40 (2.41) 22.9% | 6.26 (2.57) 10.7% | 6.07 (2.88) 7.8% | -0.11 (-.14, -.09) | -0.24 (-.26, -.22) |
| Asia (n = 23,395) | 6.29 (2.62) 6.9% | 6.34 (2.32) 21.2% | 6.44 (2.18) 36.8% | 6.21 (2.27) 19.4% | 6.20 (2.40) 8.8% | 5.85 (2.63) 7.0% | -0.17 (-.24, -.10) | -0.20 (-.26, -.15) |
| Central & Eastern Europe (n = 47,560) | 6.95 (2.84) 4.3% | 7.11 (2.52) 17.5% | 6.91 (2.36) 36.8% | 6.61 (2.46) 23.3% | 6.48 (2.62) 10.8% | 6.44 (2.93) 7.3% | -0.18 (-.23, -.12) | -0.24 (-.29, -.21) |
| English-speaking (n = 7,457) | 5.93 (2.71) 3.4% | 6.37 (2.38) 12.9% | 6.29 (2.22) 36.5% | 5.85 (2.28) 26.7% | 5.69 (2.43) 12.4% | 5.22 (2.59) 8.0% | -0.27 (-.42, -.12) | -0.46 (-.57, -.36) |
| Latin America (n = 16,594) | 6.53 (3.09) 8.2% | 6.73 (2.80) 16.1% | 6.65 (2.58) 25.8% | 6.50 (2.51) 22.2% | 6.37 (2.59) 13.5% | 6.16 (2.93) 14.1% | -0.12 (-.19, -.06) | -0.20 (-.26, -.14) |
| Middle East & North Africa (n = 11,762) | 5.78 (3.35) 14.4% | 6.43 (3.08) 19.0% | 6.27 (2.91) 28.1% | 6.25 (2.95) 18.6% | 6.19 (3.08) 10.5% | 6.10 (3.25) 9.6% | 0.10 (.03, .20) | -0.10 (-.17, .00) |
| Western Europe (n = 37,578) | 6.41 (2.67) 3.3% | 6.60 (2.35) 13.4% | 6.57 (2.15) 42.1% | 6.35 (2.24) 25.3% | 6.09 (2.40) 10.4% | 5.75 (2.70) 5.5% | -0.24 (-.29, -.15) | -0.34 (-.40, -.29) |
| Boys | ||||||||
| Worldwide (n = 141,612) | 7.09 (2.83) 8.7% | 7.39 (2.38) 22.8% | 7.38 (2.22) 34.8% | 7.29 (2.36) 18.8% | 7.29 (2.54) 8.5% | 7.20 (2.88) 6.4% | 0.04 (.01, .07) | -0.08 (-.10, -.05) |
| Asia (n = 23,114) | 6.75 (2.66) 10.9% | 6.87 (2.34) 25.1% | 6.93 (2.26) 32.4% | 6.90 (2.39) 16.9% | 6.93 (2.48) 7.8% | 6.87 (2.73) 6.9% | 0.05 (-.02, .11) | 0.00 (-.05, .05) |
| Central & Eastern Europe (n = 47,287) | 7.48 (2.77) 8.0% | 7.81 (2.25) 24.3% | 7.71 (2.16) 35.1% | 7.62 (2.33) 18.2% | 7.70 (2.48) 8.4% | 7.70 (2.79) 6.1% | 0.08 (.03, .13) | -0.04 (-.09, -.01) |
| English-speaking (n = 7,342) | 6.79 (2.58) 6.0% | 6.85 (2.29) 19.5% | 6.87 (2.17) 39.9% | 6.67 (2.30) 20.8% | 6.56 (2.48) 8.5% | 6.32 (2.82) 5.4% | -0.18 (-.31, -.04) | -0.21 (-.33, -.11) |
| Latin America (n = 16,369) | 7.27 (2.88) 10.5% | 7.50 (2.55) 20.1% | 7.50 (2.34) 27.2% | 7.51 (2.29) 21.1% | 7.41 (2.45) 11.1% | 7.45 (2.73) 10.0% | 0.06 (.00, .13) | -0.02 (-.08, .04) |
| Middle East & North Africa (n = 10,132) | 6.35 (3.43) 14.6% | 6.43 (3.10) 20.5% | 6.40 (2.95) 25.9% | 6.65 (2.96) 18.1% | 6.69 (3.09) 11.2% | 6.55 (3.37) 9.7% | 0.06 (-.04, .15) | 0.04 (-.03, .14) |
| Western Europe (n = 37,368) | 7.20 (2.55) 6.5% | 7.46 (2.14) 21.8% | 7.48 (2.00) 40.7% | 7.29 (2.17) 19.5% | 7.27 (2.36) 7.3% | 7.00 (2.81) 4.2% | -0.07 (-.14, -.01) | -0.18 (-.27, -.16) |
Note: Numbers are mean, standard deviation in parentheses, and percent in each usage category. d = difference in standard deviations. CI = confidence interval. 95% confidence intervals that do not include zero are statistically significant and are shown in bold.
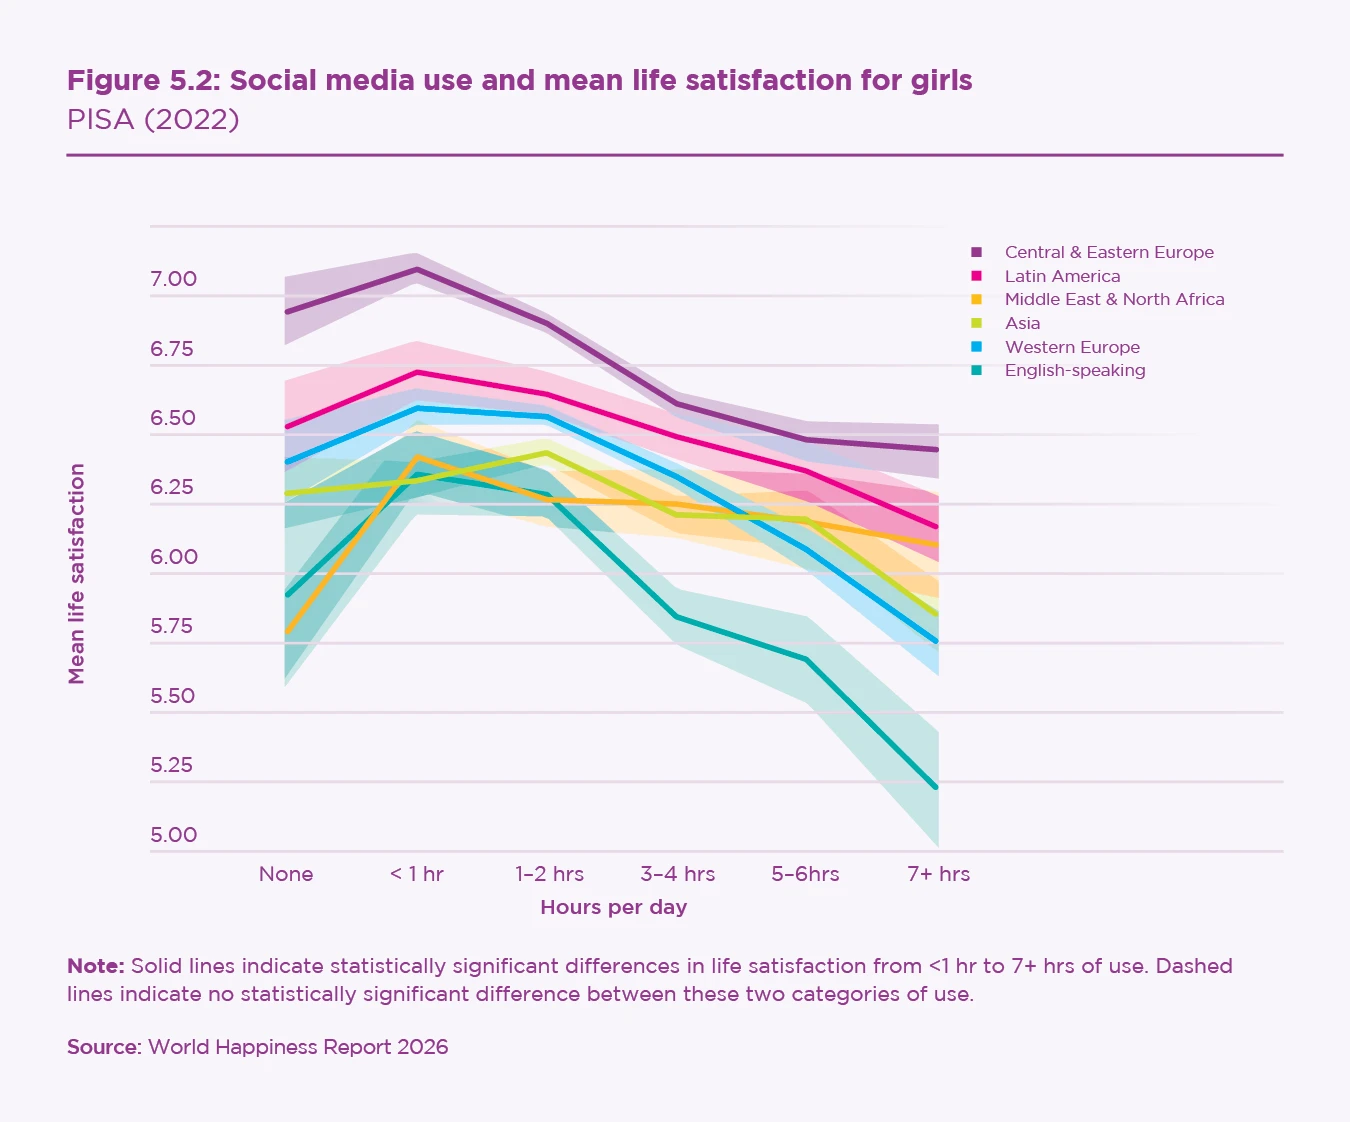
Within regions, that held true in Asia, Central and Eastern Europe, English-speaking countries, Latin America, and Western Europe, but not in the Middle East and North Africa (see Figure 5.2). The dose-response curve for social media use and mean life satisfaction appears to be curvilinear, with the lightest use (less than an hour a day) associated with the highest mean life satisfaction among girls. After more than an hour a day of social media use, life satisfaction declines.
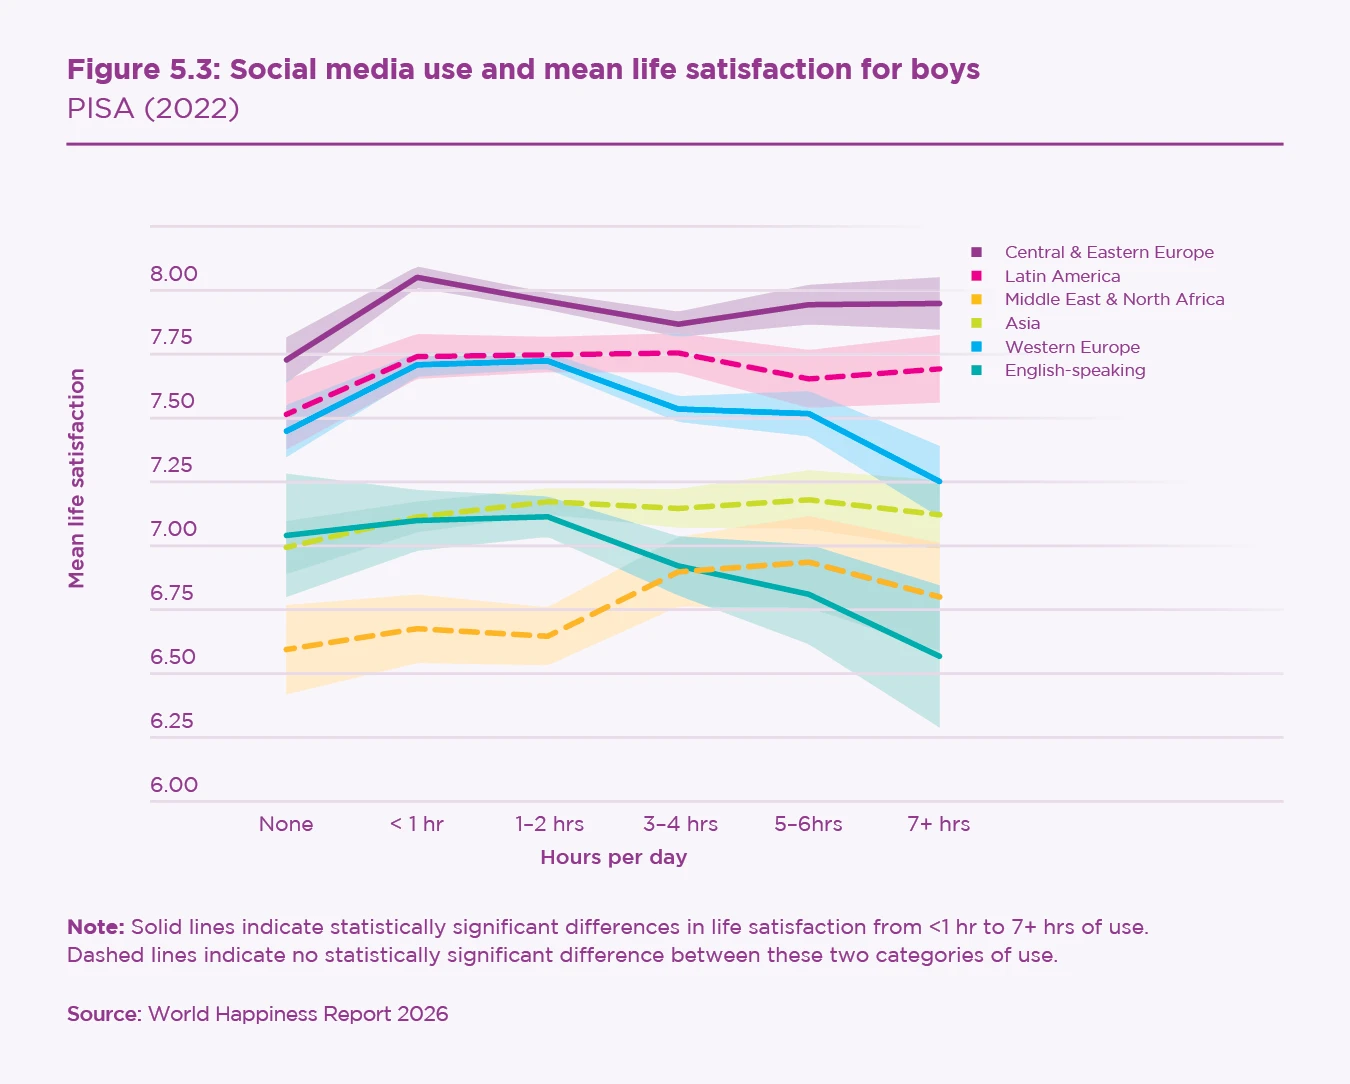
Among boys worldwide, light users of social media (though not non-users) were more satisfied with their lives than heavy users (see Table 5.2). However, there was considerable variation across regions (see Figure 5.3). In English-speaking countries and Western Europe, boys who were non-users and light users reported higher life satisfaction than heavy users. In Central and Eastern Europe, light users were more satisfied with their lives than heavy users, but non-users were less satisfied. In Asia, Latin America, and the Middle East and North Africa, differences were not statistically significant.
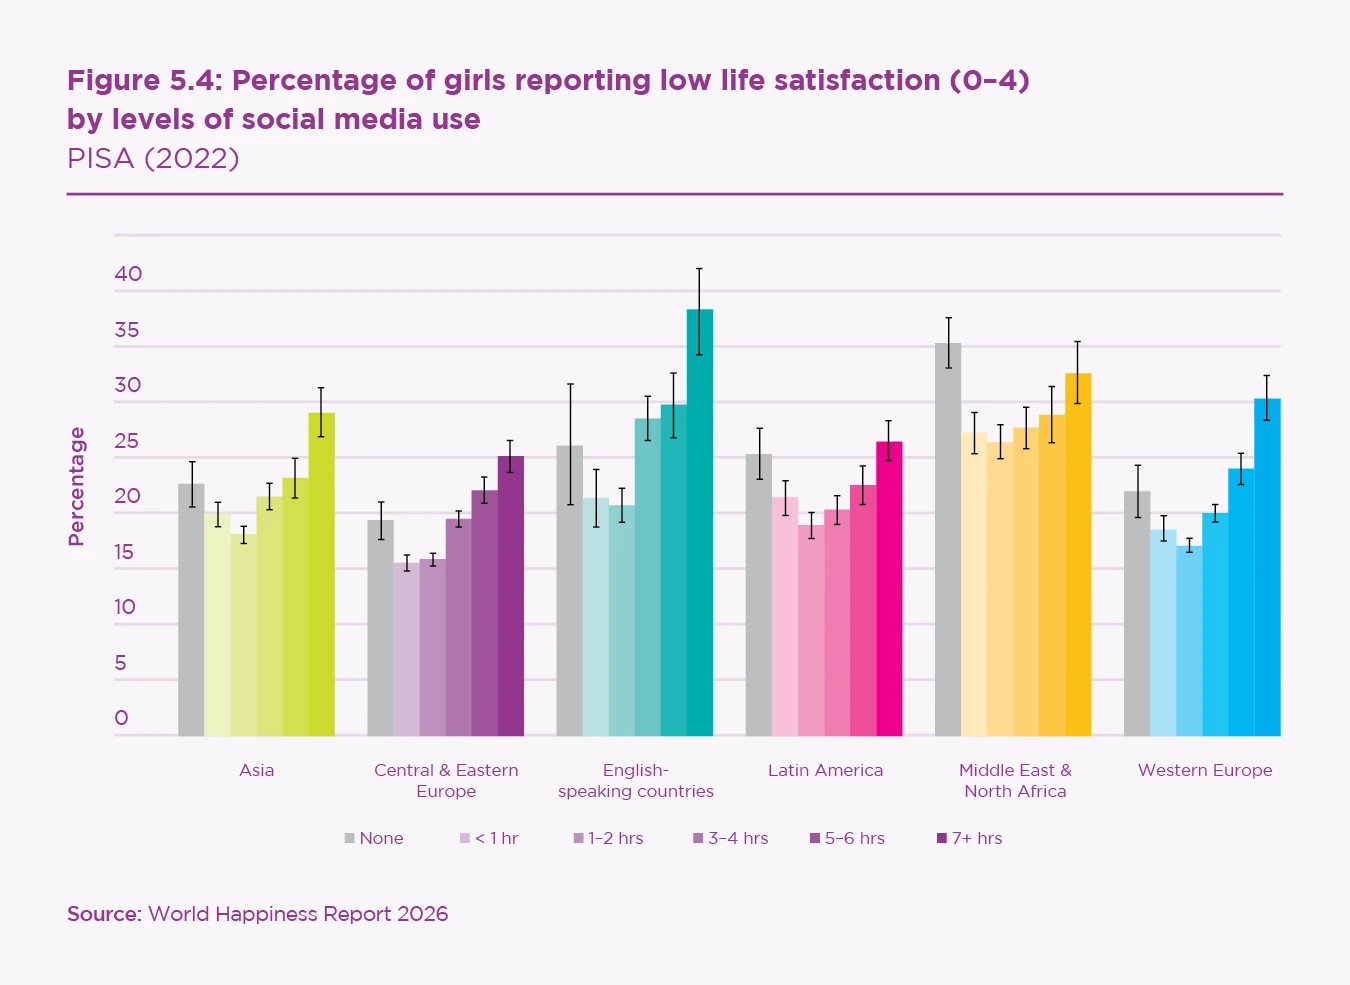
Among girls in Asia, Central and Eastern Europe, English-speaking countries, and Western Europe, heavy social media users were the most likely to report low life satisfaction (see Figure 5.4). For example, among girls in Western Europe, heavy users were 63% more likely to report low life satisfaction than light users. In Asia, they were 46% more likely, and worldwide, they were 49% more likely.
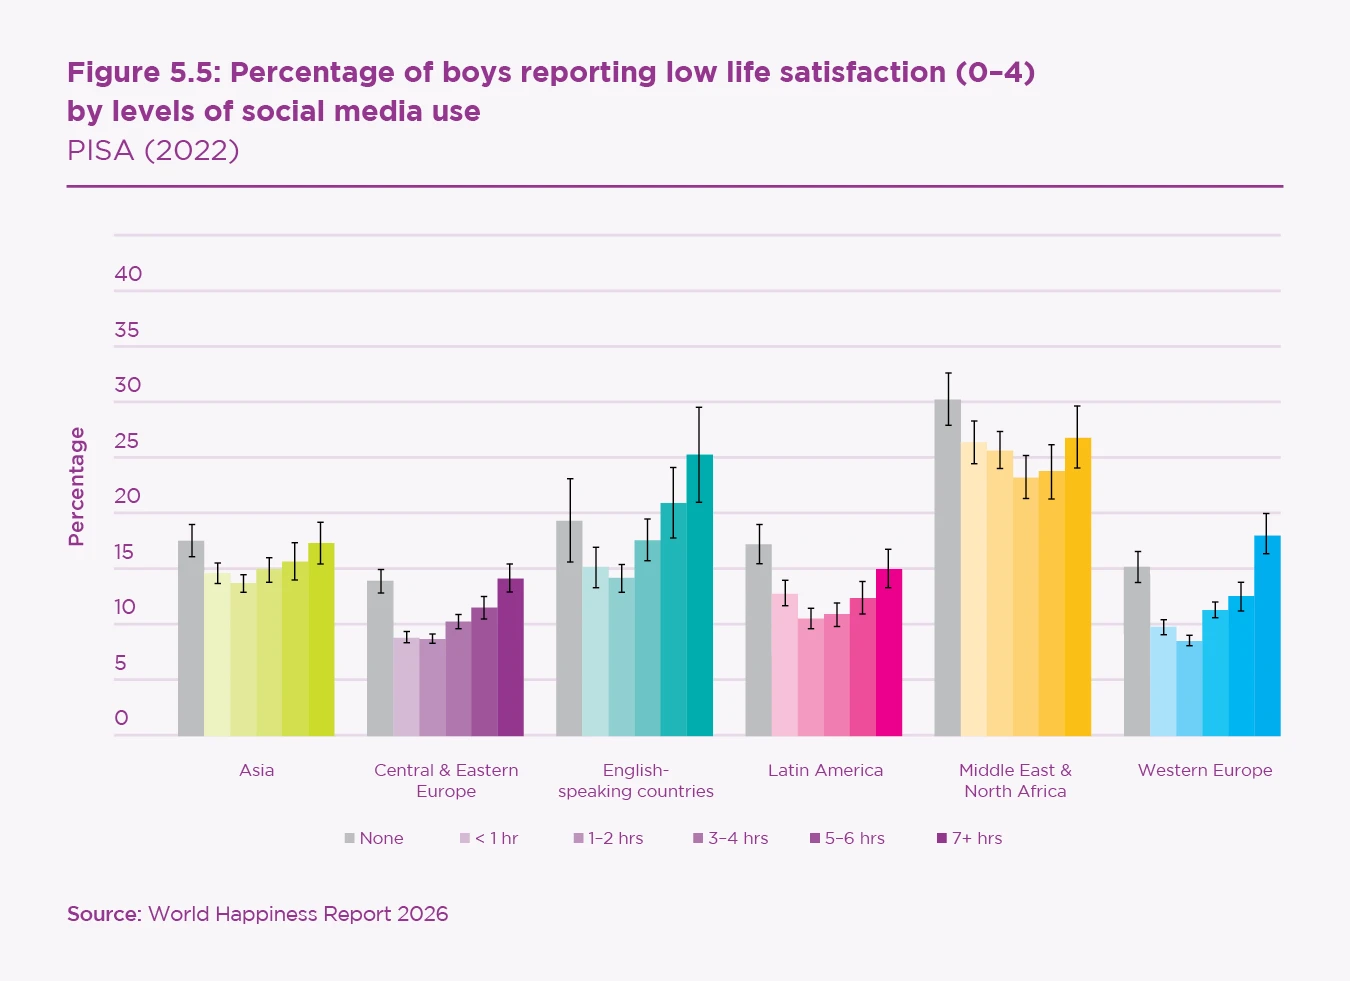
Among boys, heavy users and non-users were equally likely to report low life satisfaction, with the exception of English-speaking countries, where heavy users were the most likely to report low life satisfaction (see Figure 5.5). However, heavy users were more likely than light users to report low life satisfaction. In Western Europe, for example, heavy users were 84% more likely than light users to report low life satisfaction. The worldwide average was 44% more likely.

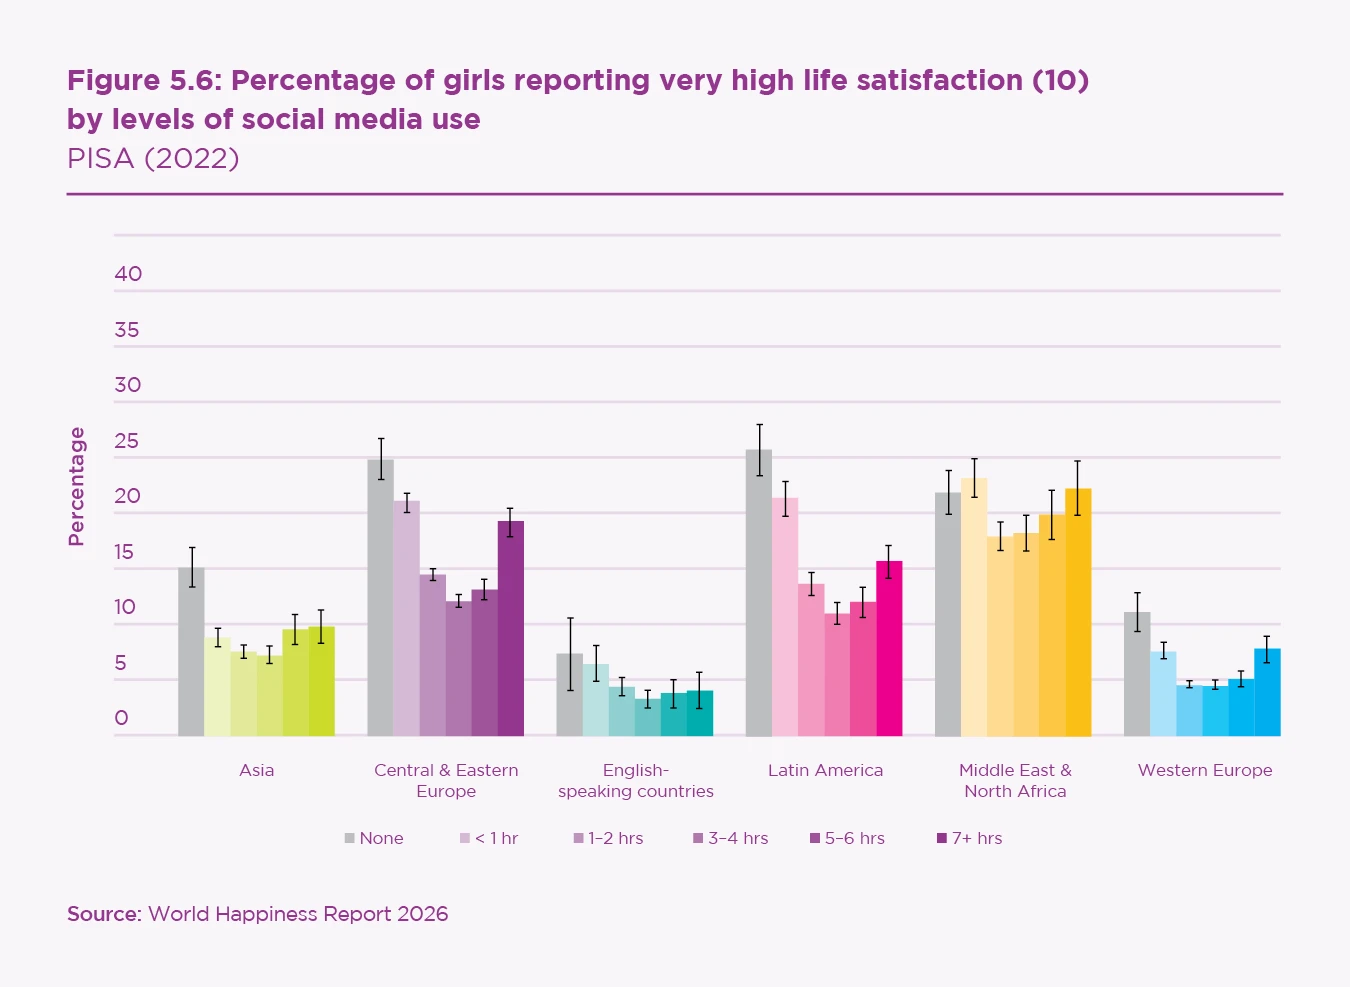
Among girls, both non-users and heavy users of social media were more likely to report complete satisfaction with their lives, choosing a 10 on the 0–10 life satisfaction scale. In Asia, Central and Eastern Europe, English-speaking countries, Latin America, and Western Europe, non-users were more likely to report very high life satisfaction (see Figure 5.6). For example, among girls in Latin America, non-users were 65% more likely to be completely satisfied with their lives than heavy users. In Central and Eastern Europe and Western Europe, heavy users were also more likely than moderate users to report high life satisfaction.
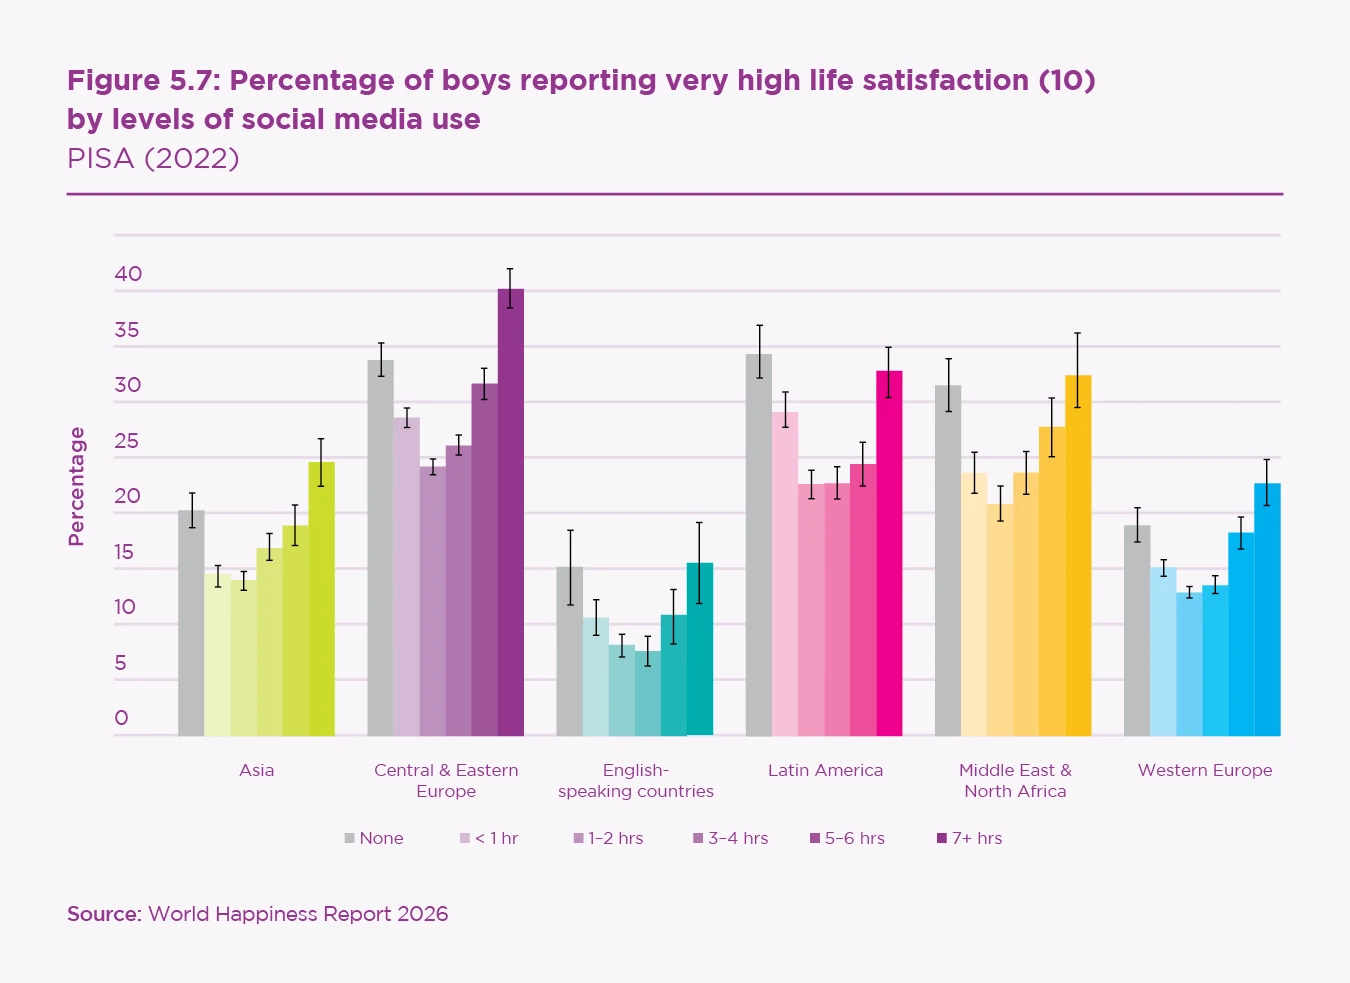
Among boys, both non-users and heavy users were more likely to report very high life satisfaction than light or moderate users (see Figure 5.7). Thus, there is more variation in levels of life satisfaction among non-users and heavy users of social media compared to light or moderate users, with more individuals at the extremes of life satisfaction, especially among boys. This is also demonstrated by the larger standard deviations among non-users and heavy users in Table 5.2.

Discussion
In an international survey of 15- to 16-year-old adolescents, girls who were light users of social media had the highest mean life satisfaction, and heavy users the lowest, in Asia, Central and Eastern Europe, English-speaking countries, Latin America, and Western Europe. Among boys, this pattern held only in English-speaking countries and Western Europe.
The differences in mean life satisfaction obscured a wider variation in life satisfaction among non-users and heavy users. Especially among boys, non-users and heavy users had higher numbers of both low (0–4) and very high (10) life satisfaction. Among girls in most regions, heavy users were the most likely to report low life satisfaction, and non-users were the most likely to report complete satisfaction with their lives.
These results are consistent with previous research, which has found lower life satisfaction and higher levels of depressive symptoms among heavy users of social media, especially among girls.
These results are consistent with previous research, which has found lower life satisfaction and higher levels of depressive symptoms among heavy users of social media, especially among girls.[7] Other studies have also found that light users report the highest levels of wellbeing,[8] especially in samples of older teens.[9] However, the null results for boys in some regions are discrepant with previous research, which has usually found significant, though smaller, links between social media and lower wellbeing among boys. These findings could be due to several factors, including cultural differences.
The effect sizes of these findings should be put in the context of previous research. Several meta-analyses have found that negative outcomes, such as depression and anxiety, are more strongly related to social media use than measures of positive wellbeing, such as life satisfaction.[10] Thus, it is not surprising that the significant effect sizes here were in the range of RR (relative risk) = 1.50 (representing a 50% difference in low life satisfaction from light to heavy use) compared to the RR of 2 or more often found for social media use and depressive symptoms.[11]
These results also illustrate the severe limitations of relying solely on linear correlation to understand the association between social media use and wellbeing. These limitations are (at least) twofold. First, linear correlation is poorly suited for curvilinear associations. For example, among boys in Central and Eastern Europe, social media use was correlated r = -.01 with life satisfaction, a result close to zero. Yet, because the association is curvilinear (see Figure 5.2), linear r obscures the significant finding that heavy users were 59% more likely to report low life satisfaction than light users.
Second, linear r alone is not sufficient for understanding the association between two variables in many cases. For example, the correlation between receiving the polio vaccine and developing paralytic polio is r = .01. Yet, those who did not receive the vaccine were 3.56 times more likely to develop paralytic polio than those who did (RR = 3.56).[12] The correlation between daily aspirin use and heart attacks is r = .03, but those who did not take aspirin were 89% more likely to have a heart attack (RR = 1.89).[13] The correlation between not wearing a seat belt and dying in a car accident is r = .07, but those not wearing a seat belt were 3.43 times more likely to die.[14]
Researchers are increasingly recognising that labelling effects as “small” is not informative, especially as effects are often cumulative and can have substantial impacts when they affect many people.
Correlations of this size are often dismissed by psychologists as “small” or of “limited practical significance”,[15] yet relative risk makes their practical significance very clear. The same is true of associations between social media and wellbeing. Researchers are increasingly recognising that labelling effects as “small” is not informative, especially as effects are often cumulative and can have substantial impacts when they affect many people.[16] Social media use, which occurs multiple times a day across many hours for most adolescents, certainly meets this standard.
The use of linear r compared to relative risk is also one reason why conclusions about the association between social media use and wellbeing have varied across fields.[17] Social and personality psychologists are trained to rely on correlation, which assumes linearity, focuses on average outcomes, and, when squared, presumably answers the question, “What percentage of the variation among individuals is linked to this factor and not others?” Physicians and public health experts have been trained to use relative risk (and the closely related statistic, odds ratios), which highlight negative outcomes and answer the question, “What is the difference in wellbeing associated with this activity?” A linear r of .10 or .15, categorised by psychologists as “small”, often corresponds to a 50% to 100% difference in depression rates among heavy users vs. non- or light users, which many would consider a meaningful elevation in risk.
Those relying on linear r may conclude the association is not practically important, while those using relative risk may conclude the association is practically important.
Still, nearly all meta-analyses in the field have relied on linear r and, thus, concluded that the association between social media use and wellbeing is present but “small”.[18] One of the few, or perhaps the only, meta-analyses that used relative risk found that the risk of depression increased 13% for each hour of social media use. Thus, those who used social media 7 hours a day would be 91% more likely to be depressed than non-users.[19] Most observers would not consider that small. These choices of statistics may be one reason why reports on social media and mental health (such as those from the National Academies of Science and the Office of the Surgeon General) have differed in their conclusions. Those relying on linear r may conclude the association is not practically important, while those using relative risk may conclude the association is practically important.
The greater variation in life satisfaction among non-users and heavy users could be due to several factors. Adolescents who spend more time using social media also spend more time seeing friends in person,[20] and seeing friends in person is linked to higher levels of happiness and life satisfaction. Thus, some of the higher levels of life satisfaction among heavier users of social media may be due to higher levels of in-person social interaction. We were unable to address this directly as PISA does not include measures of in-person social interaction with friends outside of school. In low- and middle–income countries, the lower levels of life satisfaction among non-users of social media may, in some cases, be due to economic deprivation, another factor we were unable to address directly as PISA does not include a measure of family income. Non-users of social media may also be socially isolated or display other confounding factors leading to low life satisfaction. It is also important to note that this research is correlational and, thus, cannot rule out reverse causation or third variables.

Survey response patterns may also play a role. Heavy use of social media and very high life satisfaction (10) are both extreme choices on the survey. Some respondents may have routinely responded with the highest-level choice, introducing measurement error. Thus, future research should explore whether this finding replicates. There may also be regional and cultural differences in the meaning of choosing “10” for life satisfaction, which also deserves further examination.
Overall, associations between social media use and life satisfaction among boys are only statistically significant in some regions. Among boys, heavy users of social media are more likely to report low life satisfaction and more likely to report very high life satisfaction, suggesting variation among heavy users that should be examined in future research. Among girls, the results are more straightforward, with light users reporting the highest life satisfaction and heavy users the lowest. It is notable that, in most regions, girls who did not use social media were the most likely to report complete satisfaction with their lives, although heavy users were also more likely to report complete satisfaction than moderate users in some regions.
References
Boniel-Nissim, M., van den Eijnden, R. J. J. M., Furstova, J., Marino, C., Lahti, H., Inchley, J., Šmigelskas, K., Vieno, A., & Badura, P. (2022). International perspectives on social media use among adolescents: Implications for mental and social well-being and substance use. Computers in Human Behavior, 129. https://doi.org/10.1016/j.chb.2021.107144
Burnell, K. Meter, D. J., Andrade. F. C., Slocum, A. N., & George, M. J. (2025). The effects of social media restriction: Meta-analytic evidence from randomized controlled trials. SSM-Mental Health, 7, 100459. https://doi.org/10.1016/j.ssmmh.2025.100459
Cunningham, S., Hudson, C. C., & Harkness, K. (2021). Social Media and Depression Symptoms: a Meta-Analysis. Research on child and adolescent psychopathology, 49(2), 241–253. https://doi.org/10.1007/s10802-020-00715-7
Ferguson, C. J. (2009). An effect size primer: A guide for clinicians and researchers. Professional Psychology: Research and Practice, 40, 532–538. https://doi.org/10.1037/a0015808
Funder, D. C. & Ozer, D. J. (2019). Evaluating Effect Size in Psychological Research: Sense and Nonsense. Advances in Methods and Practices in Psychological Science. 2(2), 156–168. https://doi.org/10.1177/2515245919847202
Götz, F. M., Gosling, S. D., & Rentfrow, P. J. (2022). Small effects: The indispensable foundation for a cumulative psychological science. Perspectives on Psychological Science, 17(1), 205–215. https://doi.org/10.1177/1745691620984483
Kelly, Y., Zilanawala, A., Booker, C., & Sacker, A. (2019). Social Media Use and Adolescent Mental Health: Findings from the UK millennium cohort study. EClinicalMedicine, 6, 59–68. https://doi.org/10.1016/j.eclinm.2018.12.005
Ivie, E. J., Pettitt, A., Moses, L. J., & Allen, N. B. (2020). A meta-analysis of the association between adolescent social media use and depressive symptoms. Journal of Affective Disorders, 275, 165–174. https://doi.org/10.1016/j.jad.2020.06.014
Liu, D., Baumeister, R. F., & Yang, C-C. (2024). A meta-analysis on the relationship between the use of electronic media and psychological well-being. Emerging Trends in Drugs, Addictions, and Health, 4, 100162. https://doi.org/10.1016/j.etdah.2024.100162
Liu, M., Kamper-DeMarco, K. E., Zhang, J., Xiao, J., Dong, D., & Xue, P. (2022). Time spent on social media and risk of depression in adolescents: A dose-response meta-analysis. International Journal of Environmental Research and Public Health, 19(9), 5164. https://doi.org/10.3390/ijerph19095164
Orben, A. (2020). Teenagers, screens and social media: A narrative review of reviews and key studies. Social Psychiatry and Psychiatric Epidemiology, 55, 407–414. https://doi.org/10.1007/s00127-019-01825-4
Orben, A., Przybylski, A. K., Blakemore, S.-J., & Kievit, R. A. (2022). Windows of developmental sensitivity to social media. Nature Communications, 13, 1649. https://doi.org/10.1038/s41467-022-29296-3
Przybylski, A. K., & Weinstein, N. (2017). A Large-Scale Test of the Goldilocks Hypothesis: Quantifying the Relations Between Digital-Screen Use and the Mental Well-Being of Adolescents. Psychological Science, 28, 204-215. https://doi.org/10.1177/0956797616678438
Riehm, K. E., Feder, K. A., Tormohlen, K. N., Crum, R. M., Young, A. S., Green, K. M., Pacek, L. R., La Flair, L. N., & Mojtabai, R. (2019). Associations between time spent using social media and internalizing and externalizing problems among US youth. JAMA Psychiatry, 76, 1266–1273. https://doi.org/10.1001/jamapsychiatry.2019.2325
Rosnow, R. L., & Rosenthal, R. (1989). Definition and interpretation of interaction effects. Psychological Bulletin, 105, 143–146. https://doi.org/10.1037/0033-2909.105.1.143
Rosnow, R. L., & Rosenthal, R. (2003). Effect sizes for experimenting psychologists. Canadian Journal of Experimental Psychology, 57, 221–237. https://doi.org/10.1037/h0087427
Rothwell, J. (2023). Teens spend average of 4.8 hours on social media per day. Gallup. https://news.gallup.com/poll/512576/teens-spend-average-hours-social-media-per-day.aspx
Sampasa-Kanyinga, H., & Lewis, R. F. (2015). Frequent use of social networking sites is associated with poor psychological functioning among children and adolescents. Cyberpsychology, Behavior, and Social Networking, 18, 380–385. https://doi.org/10.1089/cyber.2015.0055
Schalet, B. D., Cook, K. F., Choi, S. W., & Cella, D. (2014). Establishing a common metric for self-reported anxiety: linking the MASQ, PANAS, and GAD-7 to PROMIS Anxiety. Journal of Anxiety Disorders, 28, 88–96. https://doi.org/10.1016/j.janxdis.2013.11.006
Steinsbekk, S., Bjørklund, O., Valkenburg, P., Nesi, J., & Wichstrøm, L. (2024). The new social landscape: Relationships among social media use, social skills, and offline friendships from age 10–18 years. Computers in Human Behavior, 156. https://doi.org/10.1016/j.chb.2024.108235
Twenge, J. M., & Farley, E. (2021). Not all screen time is created equal: Associations with mental health vary by activity and gender. Social Psychiatry and Psychiatric Epidemiology, 56, 207–217. https://doi.org/10.1007/s00127-020-01906-9
Twenge, J. M., & Hamilton, J. L. (2022). Linear correlation is insufficient as the sole measure of associations: The case of technology use and mental health. Acta Psychologica, 229, e103696. https://doi.org/10.1016/j.actpsy.2022.103696
Twenge, J. M., & Martin, G. N. (2020). Gender differences in associations between digital media use and psychological well‐being: Evidence from three large datasets. Journal of Adolescence, 79, 91–102. https://doi.org/10.1016/j.adolescence.2019.12.018
Twenge, J. M., Martin, G. N., & Campbell, W. K. (2018). Decreases in psychological well-being among American adolescents after 2012 and links to screen time during the rise of smartphone technology. Emotion, 18, 765-780. https://doi.org/10.1037/emo0000403
Van der Wal, A., Beyens, I., Janssen, L. H. C., & Valkenburg, P. M. (2026). Diverse platforms, diverse effects: Evidence from a 100-day study on social media and adolescent mental health. Current Psychology, 45, 36. https://doi.org/10.1007/s12144-025-08893-7
Viner, R. M., Gireesh, A., Stiglic, N., Hudson, L. D., Goddings, A.-L., Ward, J. L., & Nicholls, D. E. (2019). Roles of cyberbullying, sleep, and physical activity in mediating the effects of social media use on mental health and wellbeing among young people in England: a secondary analysis of longitudinal data. The Lancet Child & Adolescent Health, 3, 685–696. https://doi.org/10.1016/S2352-4642(19)30186-5
Endnotes
Orben (2020); Twenge and Hamilton (2022); Van der Wal et al. (2026). ↩︎
Kelly et al. (2019); Orben et al. (2022); Riehm et al. (2019); Sampasa-Kanyinga and Lewis (2015); Twenge et al. (2018). ↩︎
Kelly et al. (2019); Twenge and Farley (2021); Twenge and Martin (2020); Viner et al. (2019). ↩︎
Cunningham et al. (2021); Ivie et al. (2020); Liu et al. (2024). ↩︎