International evidence on happiness and social media
Acknowledgments
The authors are grateful for much helpful assistance and advice from Chris Barrington-Leigh, Romina Boarini, Leoni Boyle, Roberto Castellanos, Andrew Clark, Jan-Emmanuel De Neve, Anat Noa Fanti, Len Goff, Barry Grimes, Jonathan Haidt, Sara Konrath, Richard Layard, Yeeun Lee, Jose Marquez, Max Norton, Andrew Przbylski, Julie Ray, Zach Rausch, Tyler VanderWeele, Jonathan Whitney, and Meik Wiking. We continue to be especially grateful to the Gallup World Poll data team for their kindness and efficiency in providing a full set of survey results in time for the report’s launch.

Key insights
Trends in global happiness
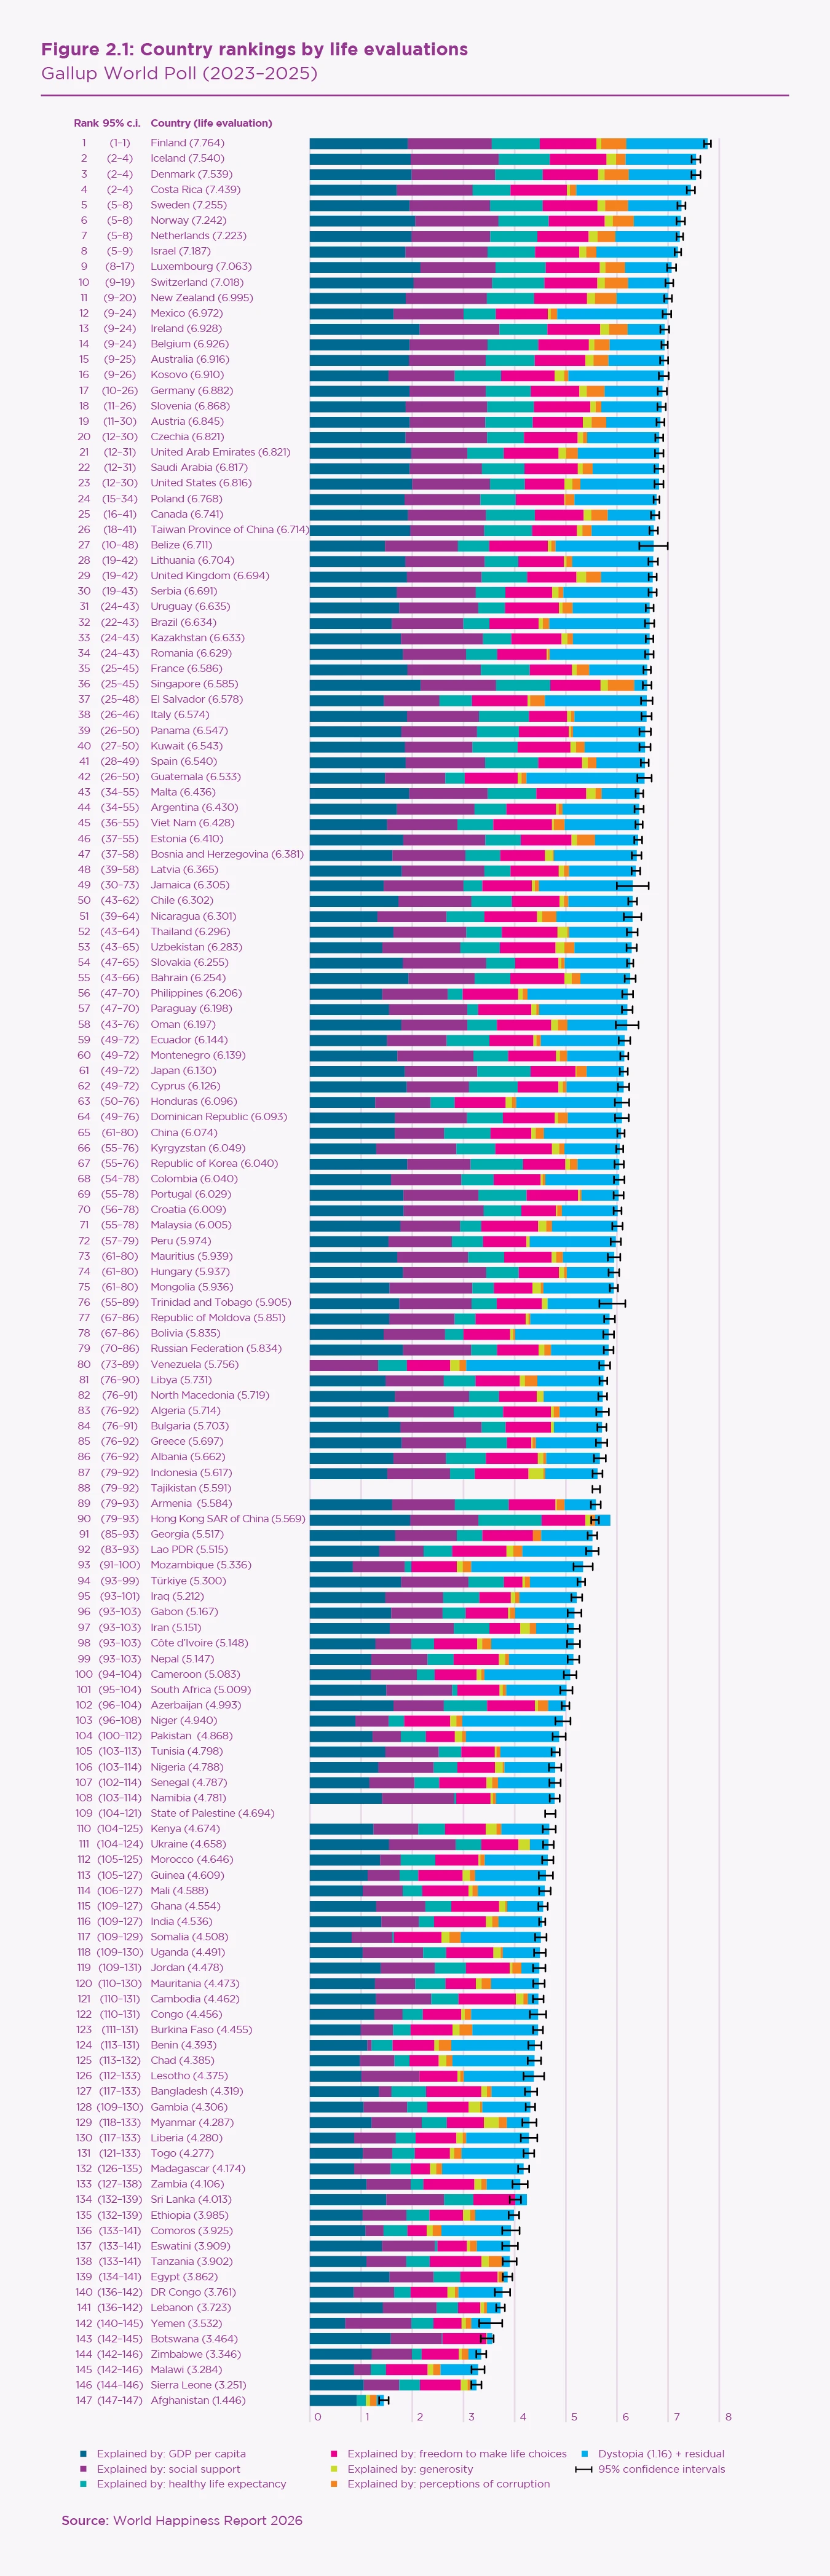
Nordic countries lead the happiness rankings once again. Finland is still in a group of one at the top, followed by a group of three: Iceland, Denmark, and Costa Rica. Sweden and Norway complete the top six, followed by the Netherlands, Israel, Luxembourg, and Switzerland to round out the top ten. Costa Rica’s rise to 4th marks the highest ever ranking for a Latin American country.
Looking at changes in happiness from the 2006–2010 base period to 2023–2025, nearly twice as many countries have had significant gains (79) than significant losses (41), among the 136 countries ranked.
Within that period, most of the 21 countries that have gained a point or more on the 0–10 life evaluation scale are in Central and Eastern Europe, reflecting the convergence in European happiness levels that has been clear for more than a decade. Most of the eight countries with drops of more than one point are in or near zones of major conflict.
In general, most Western industrial countries are now less happy than they were between 2005 and 2010. Fifteen of them have had significant drops, compared to four with significant increases.
In a ranking of happiness changes for under-25s, the United States, Canada, Australia, and New Zealand (the NANZ region) rank between 122 and 133 in the list of 136 countries.
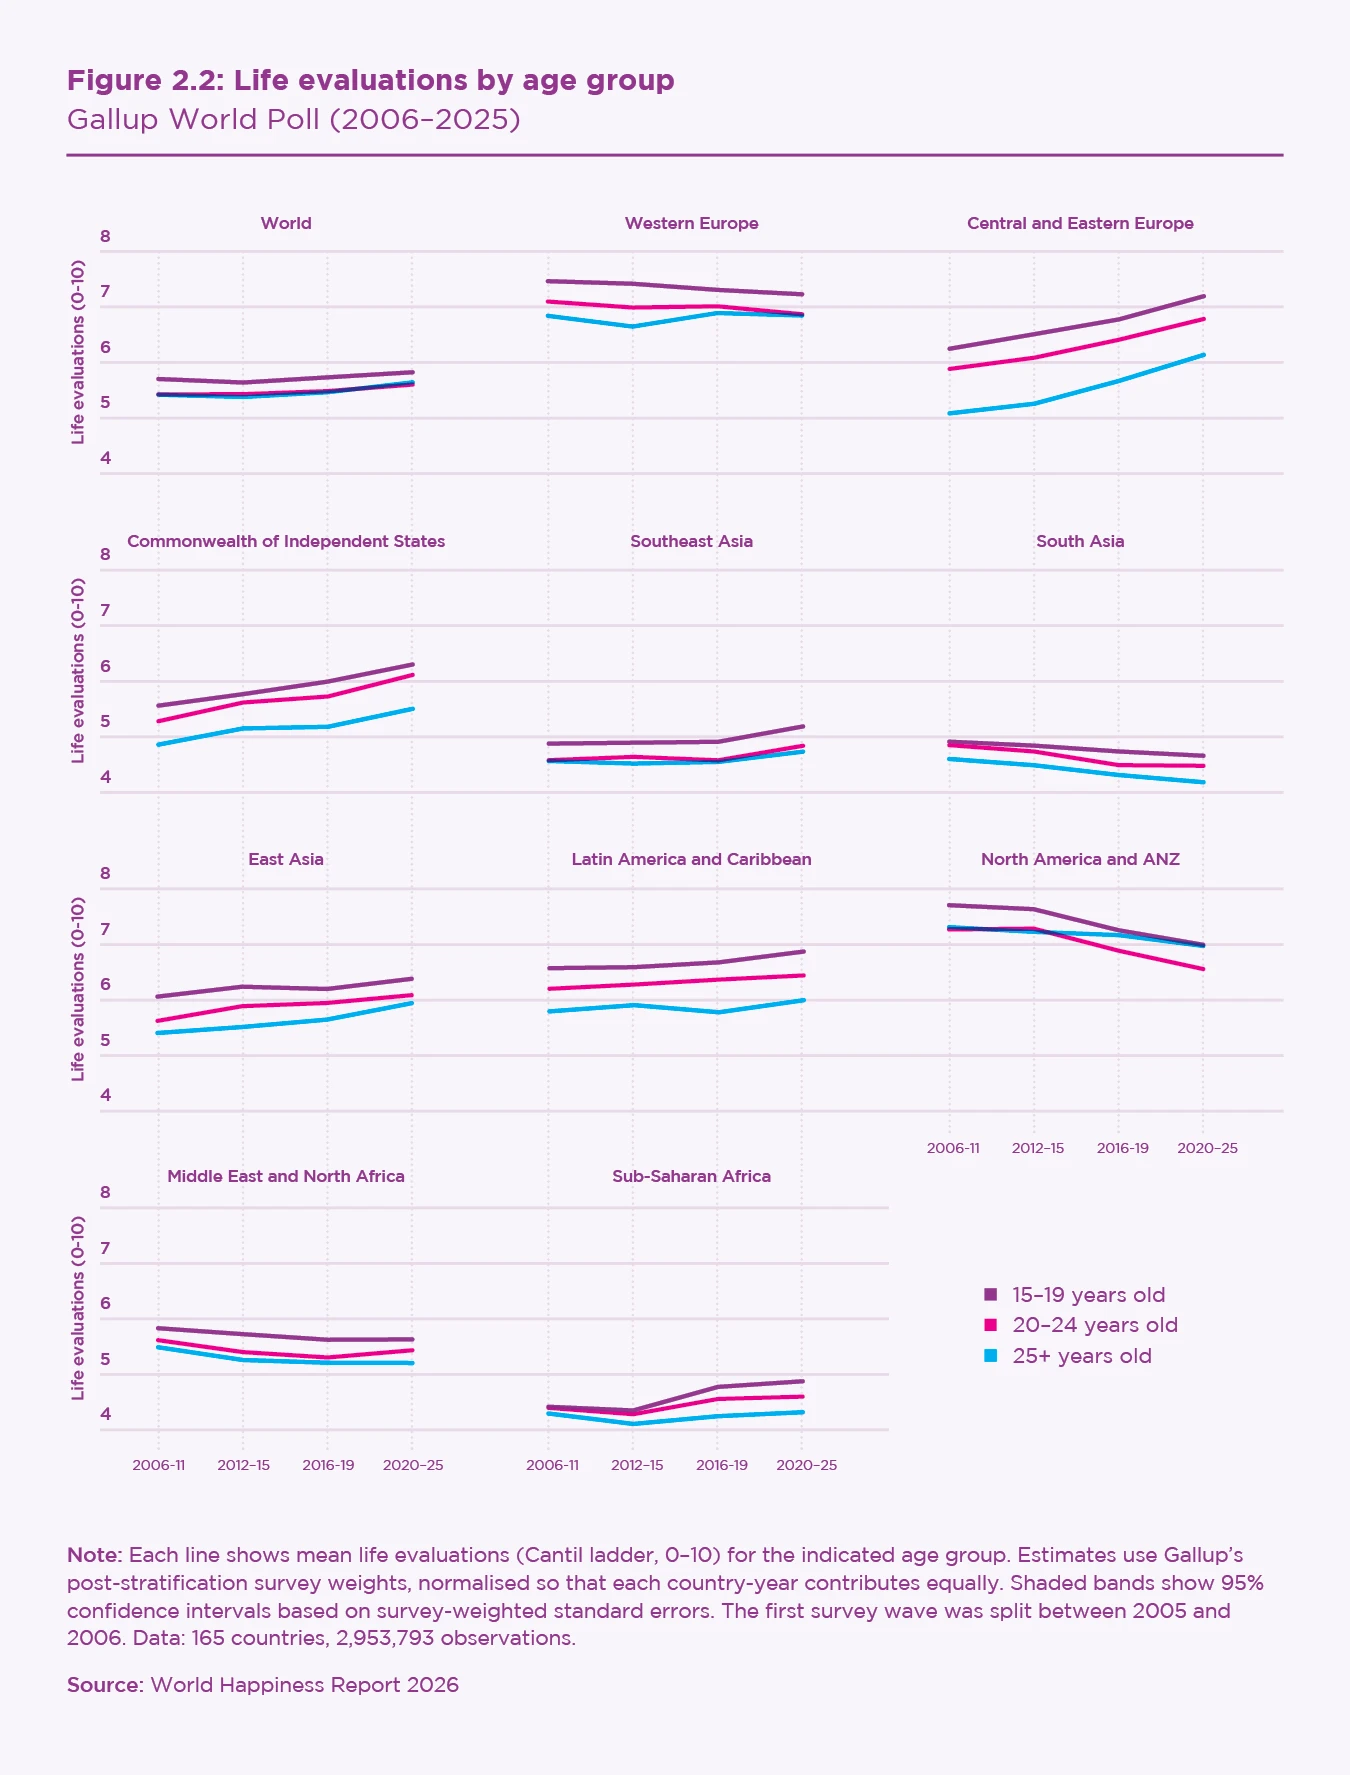
In eight of the ten global regions shown in Figure 2.2 (covering roughly 90% of the world’s population), those in the youngest age group have higher life evaluations now than in 2006–2010, either in absolute terms or relative to those over 25. Youth wellbeing has only fallen in the NANZ countries and Western Europe, both absolutely and relative to adults.
Negative emotions are becoming more common in all global regions. They are less frequent for the young, except for NANZ, where the increases, relative to other regions, were in sadness. Worry rose more broadly for the young, while the frequency of anger fell everywhere, for young and old alike.
Positive emotions continue to be twice as frequent as negative emotions. In all regions, they are higher for those born recently than for their elders, except for NANZ, where that gap has closed in recent years.
Happiness and social media
Life satisfaction is highest at low rates of social media use and lower at higher rates of use, according to data from the Programme for International Student Assessment (PISA) covering seven internet activities for 15-year-old students in 47 countries (but not the NANZ countries, unfortunately).
Internet activities fall into two groups. Communications, news, learning, and content creation are associated with higher life satisfaction. Social media, gaming, and browsing for fun are associated with lower life evaluations.
All internet activities are associated with lower life satisfaction at very high rates of use, especially for girls and for those in the UK and Ireland, the two English-speaking countries in PISA.
Data from Latin America reveal that the type of platform is crucial. Platforms designed to facilitate social connections show a clear positive association with happiness, whereas those driven by algorithmically curated content tend to demonstrate a negative association at high rates of use.
When combined, the PISA and Gallup data show significantly higher youth wellbeing in countries that spend more time using the internet for communication, and insignificantly lower youth wellbeing in countries with higher average hours of social media use. Latin American countries combine high levels of social media use with high youth wellbeing, while English-speaking countries show lower youth wellbeing than their fairly typical patterns of internet use can explain.
The prevalence and use patterns for social media are similar in all countries, but their links to life evaluations are stronger in English-speaking countries and Western Europe. These differences do not account for the large drops in youth wellbeing in these countries, however. Much, no doubt, depends on how social media is used and the broader social and economic context.
When school belonging goes from low (10th percentile) to high (90th percentile), the life satisfaction gains for girls in the UK and Ireland are four times greater than social media use going from high (90th percentile) to low (10th percentile). In PISA’s 47-country global sample, the belonging effect is six times larger. This should be relevant when policy options are being considered.
Setting the stage
Each year, Chapter 2 has two roles: first, to present and explain the latest global happiness rankings, and second, to present research on the current year’s topic. Often these two roles are closely linked, since the report’s focal topic may invite a range of alternative rankings. For example, we ranked the happiness of the native-born and the foreign-born when our topic was immigration in WHR 2018, and we ranked the happiness gaps between the more and less happy parts of the population when our focus was happiness inequality in WHR 2023.
In WHR 2024, we focused on happiness across age groups and generations. We return to that topic this year, with a special focus on the links between social media use and youth wellbeing around the world. We find striking differences in how the young have fared. In 85 of 136 countries, the under-25s are happier now (2023–2025) than they were twenty years ago (2006–2010). By contrast, in the United States, Canada, Australia, and New Zealand, life evaluations for under-25s have fallen by an average of 0.86 points on the 0 to 10 scale.[1] Why has youth happiness dropped so fast and so far in those countries?
An invited chapter in WHR 2019 used US evidence to attribute the drops in youth happiness to increased use of digital media.[2] We wondered if the timing and nature of social media use might help to explain the striking variations in youth happiness in different parts of the world, so we gathered an international team of expert authors whose contributions are in the seven chapters following this one.
To keep our own analysis consistent with that in other chapters, we consider three age categories: 15–19, 20–24, and 25 or older. We also consider the following generational splits: those born in or after 1997 (Gen Z), those born 1981–1996 (Millennials), and all those born earlier (Gen X and preceding generations). The Gallup World Poll data start at age 15, as is common with most population-based surveys, so we also analysed student data from the 2022 Programme for International Student Assessment (PISA) survey, which covers a sample of 15-year-olds in 47 countries.
We present the global rankings first, then proceed to our new research on social media.
Happiness rankings
Box 2.1: Measuring subjective wellbeing
Our measurement of subjective wellbeing continues to rely on three main indicators: life evaluations, positive emotions, and negative emotions (with the last two often referred to as positive and negative affect). Our happiness rankings are based on life evaluations, as they provide a more stable measure of the quality of people’s lives.
Life evaluations
The Gallup World Poll, which remains the principal source of data in this chapter, asks respondents to evaluate their current life as a whole using the image of a ladder, with the best possible life for them as a 10 and the worst possible as a 0. Each respondent provides a numerical response on this scale, referred to as the Cantril Ladder. Typically, around 1,000 responses are gathered annually for each country and weights are used to construct representative national averages. We base our happiness ranking on a three-year average of these life evaluations since the larger sample size enables more precise estimates.
Positive emotions
Positive affect is given by averaging yes or no answers about three positive emotions: laughter, enjoyment, and learning something interesting (for more details, see Box 2.3).
Negative emotions
Negative affect is given by averaging yes or no answers about three negative emotions: worry, sadness, and anger.
Comparing life evaluations and emotions
Life evaluations provide the most informative measure for international comparisons because they capture quality of life in a more complete and stable way than emotional reports based on daily experiences.
Life evaluations vary more between countries than emotions and they are better explained by the diverse life circumstances in different countries. Emotions are well explained by events of the day being asked about, while life evaluations more closely reflect the circumstances of life as a whole. In Table 2.1, we show that emotions are significant supports for life evaluations.
Positive emotions are more than twice as frequent as negative emotions, even during and after the COVID-19 pandemic.
As our happiness rankings have become more discussed around the world, they have naturally been subject to close scrutiny and to important questions, several of which keep reappearing as more people come to see subjective wellbeing as an appropriate measure of human welfare.[3] In Box 2.2, we answer three of the most natural and frequently asked questions.
Box 2.2: Three important questions about our approach
1. Why do you call it the World Happiness Report when more attention is paid to life evaluations than to how happy people feel?
First and foremost, happiness has been a central word in descriptions of a good life since ancient times.[4] We follow the lead of these philosophers and use the familiar label of “happiness” to refer to how people evaluate the quality of their lives.
Second, in modern times, there are two different ways of using the word “happiness.” One refers to happiness as an emotion, and the other as a judgment or evaluation, as in how happy you are about something, whether that be the weather or your life. The World Happiness Report employs both, with life evaluations measuring how happy people are with their lives as a whole, and the emotion of happiness being one of the important conduits from daily life to life evaluations. Survey respondents seem to understand this distinction, giving quite different answers depending on whether the question relates to life as a whole or to feelings now or yesterday.[5]
Third, even though the 0 to 10 scale for life evaluations covers both misery and bliss, we think it is better to think about how full life is rather than how empty. This positive focus helps to correct the prevailing negativity bias,[6] and directs attention to making lives better for all rather than waiting for and repairing damage. This positive approach, in turn, supports trust and shared purpose while more effectively reducing misery.
2. Why does the World Happiness Report continue to rank countries by average life evaluations while many governments have adopted multidimensional approaches to wellbeing?
These are not different approaches, but rather different aspects of the search for better ways to improve lives. There are many elements underlying a good life, and governments have found that a well-chosen list of important factors can help to illustrate the sources of wellbeing. The list of key factors can help governments and their ministries to focus on specific proposals to improve lives. When it comes time to evaluate competing proposals, life evaluations are used to establish the trade-offs required to make decisions. As overarching measures, life evaluations provide not only the means for making better decisions, but also the best way to judge how life is going.[7]
3. Why does the World Happiness Report rank national happiness by average life evaluations, and not by an index based on the six factors you use to explain them?
Many people mistakenly believe that we use the six explanatory factors in Table 2.1 to craft our rankings. We do not. Such an index, even though derived from the life evaluations, would still, like any index, reflect our judgments about which variables to include. Instead, we much prefer to let the judgements of individual respondents rule the rankings.
Countries are ranked according to their self-assessed life evaluations averaged over the years 2023–2025.[8] The overall length of each country bar in Figure 2.1 represents the average response to the Cantril Ladder question in the Gallup World Poll. The confidence intervals for each country’s average life evaluation are shown by horizontal whiskers at the right-hand end of each country bar. Confidence intervals for each country’s rank are displayed in brackets to the right of the rank number.[9] These ranking ranges are wider where there are many countries with similar averages and for countries with smaller sample sizes.[10]
Each country bar includes colour-coded sub-bars representing the extent to which six key variables contribute to explaining their life evaluations. These variables (described in more detail in Box 2.3) are log GDP per capita, social support, healthy life expectancy, freedom, generosity, and corruption. Our happiness rankings are not based on any index of these six factors. Rather, rankings are based on individuals’ assessments of their own lives, in particular their answers to the single-item Cantril Ladder life evaluation question. We use observed data on the six variables and estimates of their associations with life evaluations to help explain the variation of life evaluations across countries, much as epidemiologists estimate the extent to which life expectancy is affected by factors such as smoking, exercise, and diet.
The first six sub-bars show how much each of the six key variables is calculated to contribute to that country’s ladder score, relative to that in a hypothetical country called Dystopia, so named because it has values equal to the world’s lowest national averages for 2023–2025 for each of the six key variables used in Table 2.1. We use Dystopia as a benchmark against which to compare contributions from each of the six factors. The choice of Dystopia as a benchmark permits every real country to have a positive (or at least zero) contribution from each of the six factors. We calculate, based on the estimates in the first column of Table 2.1, that Dystopia had a 2023–2025 ladder score equal to 1.16 on the 0–10 scale. The final sub-bar is the sum of two components: the calculated average 2023–2025 life evaluation in Dystopia (= 1.16) and each country’s own prediction error, which measures the extent to which life evaluations are higher or lower than predicted by our equation in the first column of Table 2.1. These residuals are as likely to be negative as positive.
Consistency and change in happiness rankings
Two features carry over from previous editions of the World Happiness Report. First, there is a lot of year-to-year consistency in the way people rate their lives in different countries. Since our rankings are based on a three-year average, information is carried forward from one year to the next. The effects of cataclysmic events depend on when the survey took place and are muted by the three-year averaging.
Second, there remains a large gap between the top and bottom countries – more than six points (on the 0–10 scale) between Finland at the top and Afghanistan at the bottom. The top countries are more tightly grouped than the bottom ones. The top twenty have a spread of less than one point on the 0–10 scale, with the corresponding spread among the bottom twenty being three times as great. The remaining 107 countries cover the remaining 2.4 points of the total range. This means that relatively modest changes in a national average can lead to a large shift in rank, as illustrated by 95% confidence regions of more than 25 ranks for several countries in the middle of the global list.
Happiness scores are based on the resident populations in each country, rather than citizenship or place of birth. In WHR 2018, we split the responses between the native and foreign-born populations in each country and found the happiness rankings to be essentially the same for the two groups.[11] There was some source-country effect after migration and some tendency for migrants to move to happier countries so that, among the 20 happiest countries in that report, the average happiness for natives was about 0.2 points higher than the foreign-born.
There remains a large gap between the top and bottom countries – more than six points (on the 0–10 scale) between Finland at the top and Afghanistan at the bottom.
Nordic countries once again lead the happiness rankings. Finland is still in a group of one at the top, followed by Iceland, Denmark, and Costa Rica in a group of three (as shown by their 2–4 ranking range in Figure 2.1). Sweden and Norway complete the top six, followed by the Netherlands, Israel, Luxembourg, and Switzerland to round out the top ten. Costa Rica’s rise to 4th marks the highest ever ranking for a Latin American country.
If we compare this year’s top-ranking countries with those in WHR 2013 – the first to assign rankings based on three-year averages – we find 14 western industrial countries in the top 20 in both years. In 2013, these countries were accompanied by four from Latin America (Costa Rica, Panama, Mexico, and Venezuela) and one from the Middle East (Israel). Reflecting the long-term convergence between Eastern and Western Europe,[12] three of the top 20 countries in 2026 are now from Central and Eastern Europe (Kosovo at 16, Slovenia at 18, and Czechia at 20). This year’s top 20 also includes two countries from Latin America (Costa Rica at 4 and Mexico at 12) and one from the Middle East (Israel at 8). In 2013, the top ten countries were all western industrial countries, but now only eight are. As a group, the five Nordic countries have improved their positions in the top ten, with an average rank of 4.8 in 2013, rising to 3.4 in 2026. This increase is driven mainly by Finland (from 7 to 1) and Iceland (from 9 to 2). The industrial countries pushed out of the top ten between 2013 and 2026 include Canada (from 6 to 25), Austria (from 8 to 19), and Australia (from 10 to 15).
For the least happy countries, ranks are not so easily compared since there were 156 countries ranked in 2013 compared to 147 this year. Togo was the least happy country in 2013 and has since risen 20 places, with an average life evaluation almost 1.4 points higher now than then. Afghanistan has gone in the reverse direction with a drop of almost 2.7 points between 2013 and 2026. The average life evaluation is now 1.45, slightly up from last year, when it was the lowest average score ever seen in all our reports. Furthermore, life is especially difficult for Afghan women, as their average life satisfaction is only 1.26 points.[13]
In the middle and lower sections of the rankings, it is more meaningful to look at the average life evaluations, because a country’s rank can change many places with only a small change in average life evaluation. That is why, when we consider changes in happiness, we consider how current average life evaluations compare with those during the first years of the Gallup World Poll (2006–2010). Figures 16 to 18 in the online statistical appendix measure the change in average life evaluations from the 2006–2010 base period to the current ranking period, 2023–2025. The top five gainers are all in Central and Eastern Europe: Serbia, Bulgaria, Georgia, Latvia, and Bosnia and Herzegovina. Of the 21 countries that have gained a point or more on the 0–10 scale, most are in Central and Eastern Europe, reflecting the European happiness convergence that has been clear for more than a decade. Other big gainers include China, Mongolia, the Philippines, Togo, Nicaragua, Viet Nam, and the Dominican Republic.
Fortunately, there are fewer countries whose life evaluations have fallen by more than one point on the 0–10 scale. Going from the largest to the smallest drops in life evaluations, these eight countries are Afghanistan, Malawi, Lebanon, Jordan, Venezuela, Botswana, Egypt, and Yemen. These are mainly countries in or near zones of major conflict.
In general, the western industrial countries are now less happy than they were between 2006 and 2010. Fifteen of them have had significant drops, compared to four with significant increases.[14]
Among the 136 countries included in the 2006–2010 and 2023–2025 data, there are 79 with statistically significant gains[15] and 41 with significant drops in their life evaluations.[16] Those with significant drops include western industrialised countries with previously, and even currently, high rankings.
The rankings for positive emotions are shown in Figures 40–42 of the online statistical appendix. The top ten include six from Latin America, two from Southeast Asia, and one each from Sub-Saharan Africa and Western Europe. The lowest frequency of positive emotions is in Afghanistan. It also ranks in the top five with the most frequent negative emotions. In the top ten for negative emotions it is joined by two Middle Eastern countries, six African countries, and Armenia (see Figures 43–45 of the online statistical appendix).

Why do happiness levels differ?
In Table 2.1, we present our latest modelling of national average life evaluations and measures of positive and negative emotions (often referred to as positive and negative affect) by country and year.[17] The results in the first column explain national average life evaluations in terms of six variables: log GDP per capita, healthy life expectancy, social support (having someone to count on), freedom to make life choices, generosity, and perceptions of corruption.[18] Taken together, these six variables explain more than three-quarters of the variation in life evaluations across countries and years, using data from 2006 through 2025.[19]
The six variables were originally chosen as the best available measures of factors established in both experimental and survey data as having significant links to subjective wellbeing, and especially to life evaluations.[20] The explanatory power of the unchanged model has gradually increased as we have added more years to the sample, which is now almost three times as large as when the equation was first introduced in WHR 2013. We keep looking for possible improvements when and if new evidence becomes available.[21] The number of years of data is now great enough that we can experiment with including country fixed effects, as shown in Table 10 of the online statistical appendix. The results are similar.[22]
The second and third columns of Table 2.1 use the same six variables to estimate equations for national averages of positive and negative affect, where both are based on answers about yesterday’s emotional experiences.[23] In general, emotional measures, especially negative ones, are differently, and much less fully, explained by the six variables than are life evaluations. GDP per capita and healthy life expectancy significantly predict life evaluations,[24] but not, in these national average data, positive emotions.[25] However, the social variables do significantly predict both positive and negative emotions. Bearing in mind that positive and negative emotions are measured on a 0–1 scale, while life evaluations are measured on a 0–10 scale, having someone to count on can be seen to have similar proportionate effects on positive and negative emotions as it does on life evaluations. Freedom and generosity have even larger associations with positive emotions than with the Cantril Ladder. Negative emotions are significantly reduced by social support, a sense of freedom, and the absence of corruption.
In the fourth column, we re-estimate the life evaluation equation from column 1, adding both positive and negative emotions to partially implement the Aristotelian presumption that sustained positive emotions are important supports for a good life.[26] The results continue to buttress a finding in psychology that the existence of positive emotions matters more than the absence of negative ones when predicting either longevity[27] or resistance to the common cold.[28] Consistent with this evidence, we find that positive affect has a large and highly significant coefficient in the final equation of Table 2.1, while negative affect has none.
As for the coefficients on the other variables in the fourth column, the changes are substantial only on those variables – especially freedom and generosity – that have the largest associations with positive affect. Thus, we can infer that positive emotions play a strong role in supporting life evaluations and that much of the impact of freedom and generosity on life evaluations is channelled through their influence on positive emotions. That is, freedom and generosity have large impacts on positive affect, which in turn has a major impact on life evaluations.
| Dependent variable | ||||
|---|---|---|---|---|
| Independent variable | Cantril Ladder | Positive affect | Negative affect | Cantril Ladder |
| Log GDP per capita | 0.297 | -0.014 | -0.002 | 0.328 |
| (0.067)*** | (0.009) | (0.007) | (0.062)*** | |
| Social support | 2.82 | 0.309 | -0.337 | 2.206 |
| (0.367)*** | (0.055)*** | (0.041)*** | (0.368)*** | |
| Healthy life expectancy at birth | 0.035 | -0.001 | 0.003 | 0.037 |
| (0.009)*** | (0.001) | (0.0009)*** | (0.009)*** | |
| Freedom to make life choices | 1.546 | 0.386 | -0.092 | 0.734 |
| (0.297)*** | (0.047)*** | (0.038)** | (0.277)*** | |
| Generosity | 0.339 | 0.082 | 0.027 | 0.158 |
| (0.241) | (0.032)** | (0.027) | (0.23) | |
| Perceptions of corruption | -0.662 | -0.015 | 0.096 | -0.641 |
| (0.244)*** | (0.028) | (0.021)*** | (0.229)*** | |
| Positive affect | 2.157 | |||
| (0.322)*** | ||||
| Negative affect | 0.145 | |||
| (0.378) | ||||
| Year fixed effects | Included | Included | Included | Included |
| Number of countries | 155 | 155 | 155 | 155 |
| Number of observations | 2365 | 2360 | 2364 | 2359 |
| Adjusted R-squared | 0.762 | 0.431 | 0.354 | 0.785 |
Note: This is a pooled OLS regression for a tattered panel explaining annual national average Cantril Ladder and affect measures from all available surveys from 2005 through 2025. See Box 2.3 for detailed information about each of the predictors. Coefficients are reported with robust standard errors clustered by country (in parentheses). ***, **, and * indicate significance at the 1, 5, and 10 percent levels respectively.
Box 2.3: Explaining the variables in Table 2.1
GDP per capita is in terms of Purchasing Power Parity (PPP) adjusted to constant 2021 international dollars, taken from the World Development Indicators (WDI) by the World Bank (last updated: 19 December 2025). See the online statistical appendix for more details. GDP data for 2025 are not yet available, so we extend the GDP time series from 2024 to 2025 using country-specific forecasts of real GDP growth from the OECD Economic Outlook (edition 2025/2, last updated: 8 December 2025) or, if missing, from the World Bank’s Global Economic Prospects (last updated: 10 June 2025), after adjustment for population growth. The equation uses the natural log of GDP per capita as this form fits the data significantly better than GDP per capita.
The time series for healthy life expectancy at birth are constructed based on data from the World Health Organization (WHO) Global Health Observatory data repository, with data available up to 2021 (last updated: 2 August 2024). To match this report’s sample period (2005–2025), interpolation (when necessary) and extrapolation are used. See the online statistical appendix for more details.
Social support is the national average of the binary responses (0 = no, 1 = yes) to the Gallup World Poll (GWP) question, “If you were in trouble, do you have relatives or friends you can count on to help you whenever you need them, or not?”
Freedom to make life choices is the national average of binary responses to the GWP question, “Are you satisfied or dissatisfied with your freedom to choose what you do with your life?”
Generosity is the residual from regressing the national average of GWP responses to the question, “Have you donated money to a charity in the past month?” on log GDP per capita.
Perceptions of corruption is the average of binary answers to two GWP questions: “Is corruption widespread throughout the government or not?” and “Is corruption widespread within businesses or not?” Where data for government corruption are missing, the perception of business corruption is used as the overall corruption-perception measure.
Positive affect is the average of previous-day affect measures for laughter, enjoyment, and doing interesting things.
Negative affect is the average of previous-day affect measures for worry, sadness, and anger.
The general form for the affect questions is: “Did you experience the following feelings during a lot of the day yesterday?” The inclusion of ‘doing interesting things’ (first added for WHR 2022) gives us three components in each of positive and negative affect, and slightly improves the equation fit in column 4.
The variables we use in our Table 2.1 modelling may be taking credit due to other variables or unmeasured factors. There are also likely to be vicious or virtuous circles, with two-way linkages among the variables. For example, there is much evidence that those who have happier lives are likely to live longer,[29] be more trusting and cooperative, and generally better able to meet life’s demands.[30] This will double back to improve health, income, generosity, corruption, and a sense of freedom. Collectively, these possibilities suggest that we should interpret the observed relationships with some caution.
Another possible reason for a cautious interpretation of our results is that some of the data (social support, freedom, generosity, and perceptions of corruption) come from the same respondents as the life evaluations and are thus possibly determined by common factors. This is less likely when comparing national averages because individual differences in personality and individual life circumstances tend to average out at the national level. To provide even more assurance that our results are not significantly biased because we are using the same respondents, we tested the robustness of our procedure by splitting each country’s respondents randomly into two groups.[31] We then examined whether the average values of social support, freedom, generosity, and perceptions of corruption from one half of the sample explained average life evaluations in the other half of the sample. The coefficients on each of the four variables fell slightly in our Cantril Ladder equation, just as we expected.[32] But the changes were reassuringly small (all less than 6%).[33]
Overall, the model explains average life evaluation levels quite well within regions, among regions, and for the world as a whole.[34] On average, the countries of Latin America still have mean life evaluations that are significantly higher than predicted by the model (by about 0.5 on the 0–10 scale). This difference has been attributed to a variety of factors including some unique features of family and social life in Latin American countries.[35] In partial contrast, countries in East Asia have average life evaluations below predictions, although only slightly and insignificantly so in our latest results.[36] This may reflect, at least in part, cultural differences in the way people think about and report on the quality of their lives.[37] It is reassuring that our findings about the relative importance of the six factors are generally unaffected by whether or not we make explicit allowance for these regional differences.[38]

Happiness and social media
This is the third report in which we have given special attention to the distribution of happiness by age, gender, generation, and global region. The first was in a special chapter of WHR 2015, where we used data covering all waves from 2006 through most of 2014.[39] As already noted, we subsequently had a guest chapter using US evidence to attribute drops in youth happiness to increased use of digital media.[40]
We returned to the age topic in WHR 2024, when the levels and trends of happiness by age, gender, and generation were the primary focus of all our chapters. We found that the trends for happiness of different age groups differed sharply among world regions. This year, we circle back to see to what extent internet access and social media use might help to explain the globally varied happiness trajectories, especially for the younger generations.
There are narrower and broader definitions of social media, and both are important for this chapter. The narrower one, central to all of the chapters in this report, refers to popular social media platforms, such as Instagram, Snapchat, and TikTok. A broader version includes these platforms plus other interactive technologies that facilitate the exchange of ideas and the creation of social connections. One example of a broader definition of social media, drawn from two US scientific panels,[41] is:
“Interactive technologies that facilitate the creation and sharing of information, ideas, interests, and other forms of expression through virtual communities and networks.”
This definition is broad enough to include all of the social media platforms studied explicitly in this and other chapters of the report, as well as other interactive technologies that enable the sharing of information, ideas, and interests, and to support social connections. In particular, Zoom, FaceTime, iMessage, Slack, and a variety of other internet-based platforms for social communication provided just-in-time means for people all over the world forced by COVID-19 to use the internet to replace in-person meetings. In WHR 2021, we found an astonishing stability of life evaluations despite widespread loss of life and almost universal disruption of the face-to-face connections that support happier lives. We attributed this resilience to an outbreak of kindness, especially to strangers, and to internet-based communication channels that permitted faces in a square screen to replace the inaccessible in-person faces of loved ones, colleagues, and classmates, near and far.
Connective platforms like FaceTime and Zoom are not among the social media platforms that are the focus of public debates and several other chapters of this report, but they came into existence and widespread use about the same time. As such, their consequences for wellbeing are inevitably included in the data we are trying to understand. Thus, they may very well be an important part of explaining the results we report later in the chapter. We note that researchers such as Twenge, Haidt, and Rausch, who say that heavy social media use is harming youth mental health, do not predict harm from Zoom, Slack, Substack, blogs, messaging, FaceTime, and the many other ways that the internet connects people. Later in the chapter, we shall use PISA data to make international comparisons of the amounts of time students devote to a variety of activities on the internet, with social media being one of seven categories.
First, we update and reorganise our WHR 2024 analysis of happiness by age and gender to reflect the data divisions used in the literature on the consequences of social media use, and especially in the other chapters of this report. Our primary dependent variable remains the Cantril Ladder life evaluation. We also track positive and negative affect as possible mediators between social media use and life evaluations. Emotions are also important in their own right.
Our primary regional splits continue to be the ten global regions used regularly in our previous reports. We also show gender differences in life evaluations and emotions, as does much of the research on social media and wellbeing.
Once again, the NANZ region is exceptional. It is the only group of countries where the positive emotions advantage has disappeared.
Trends in youth wellbeing
Figure 2.2 shows life evaluations for the world and by region, for three age groups, across four time periods. The first time period includes all waves from 2006[42] through 2011, which we treat as our base period against which to evaluate subsequent changes. The second time period includes 2012 through 2015, when smartphone use of social media was in its early stages and rising at different rates around the world. The third time period covers the remaining pre-COVID-19 years (2016–2019), while the fourth includes 2020–2025. Reflecting our focus on social media and youth happiness, we distinguish three age groups: 15–19, 20–24, and all those 25 and older. Our world and regional averages give equal weight to each country.[43]
Study of the effects of social media use has been especially focused on recent generations.[44] In WHR 2024, we combined Millennials (born 1981–1996) and Gen Z (born 1997 and after). We now wish to dig deeper into the experiences for these two birth generations, so in Figure 2.3 we separate those born 1981–1996 from those born in 1997 and after, with a comparison group combining all those born in 1980 and before (Gen X+).
These graphs show that those born in and after 1997 (Gen Z) have typically reported the highest life evaluations in all years and global regions, with Millennials a bit lower and Gen X+ lowest. In the NANZ region (the United States, Canada, Australia, and New Zealand), those in the youngest generation reported an initial increase in life evaluations (pre-smartphones) but then a sharp decline through the third and fourth periods. Millennials showed a similar pattern, while older respondents showed little change in life evaluations across the four time periods.
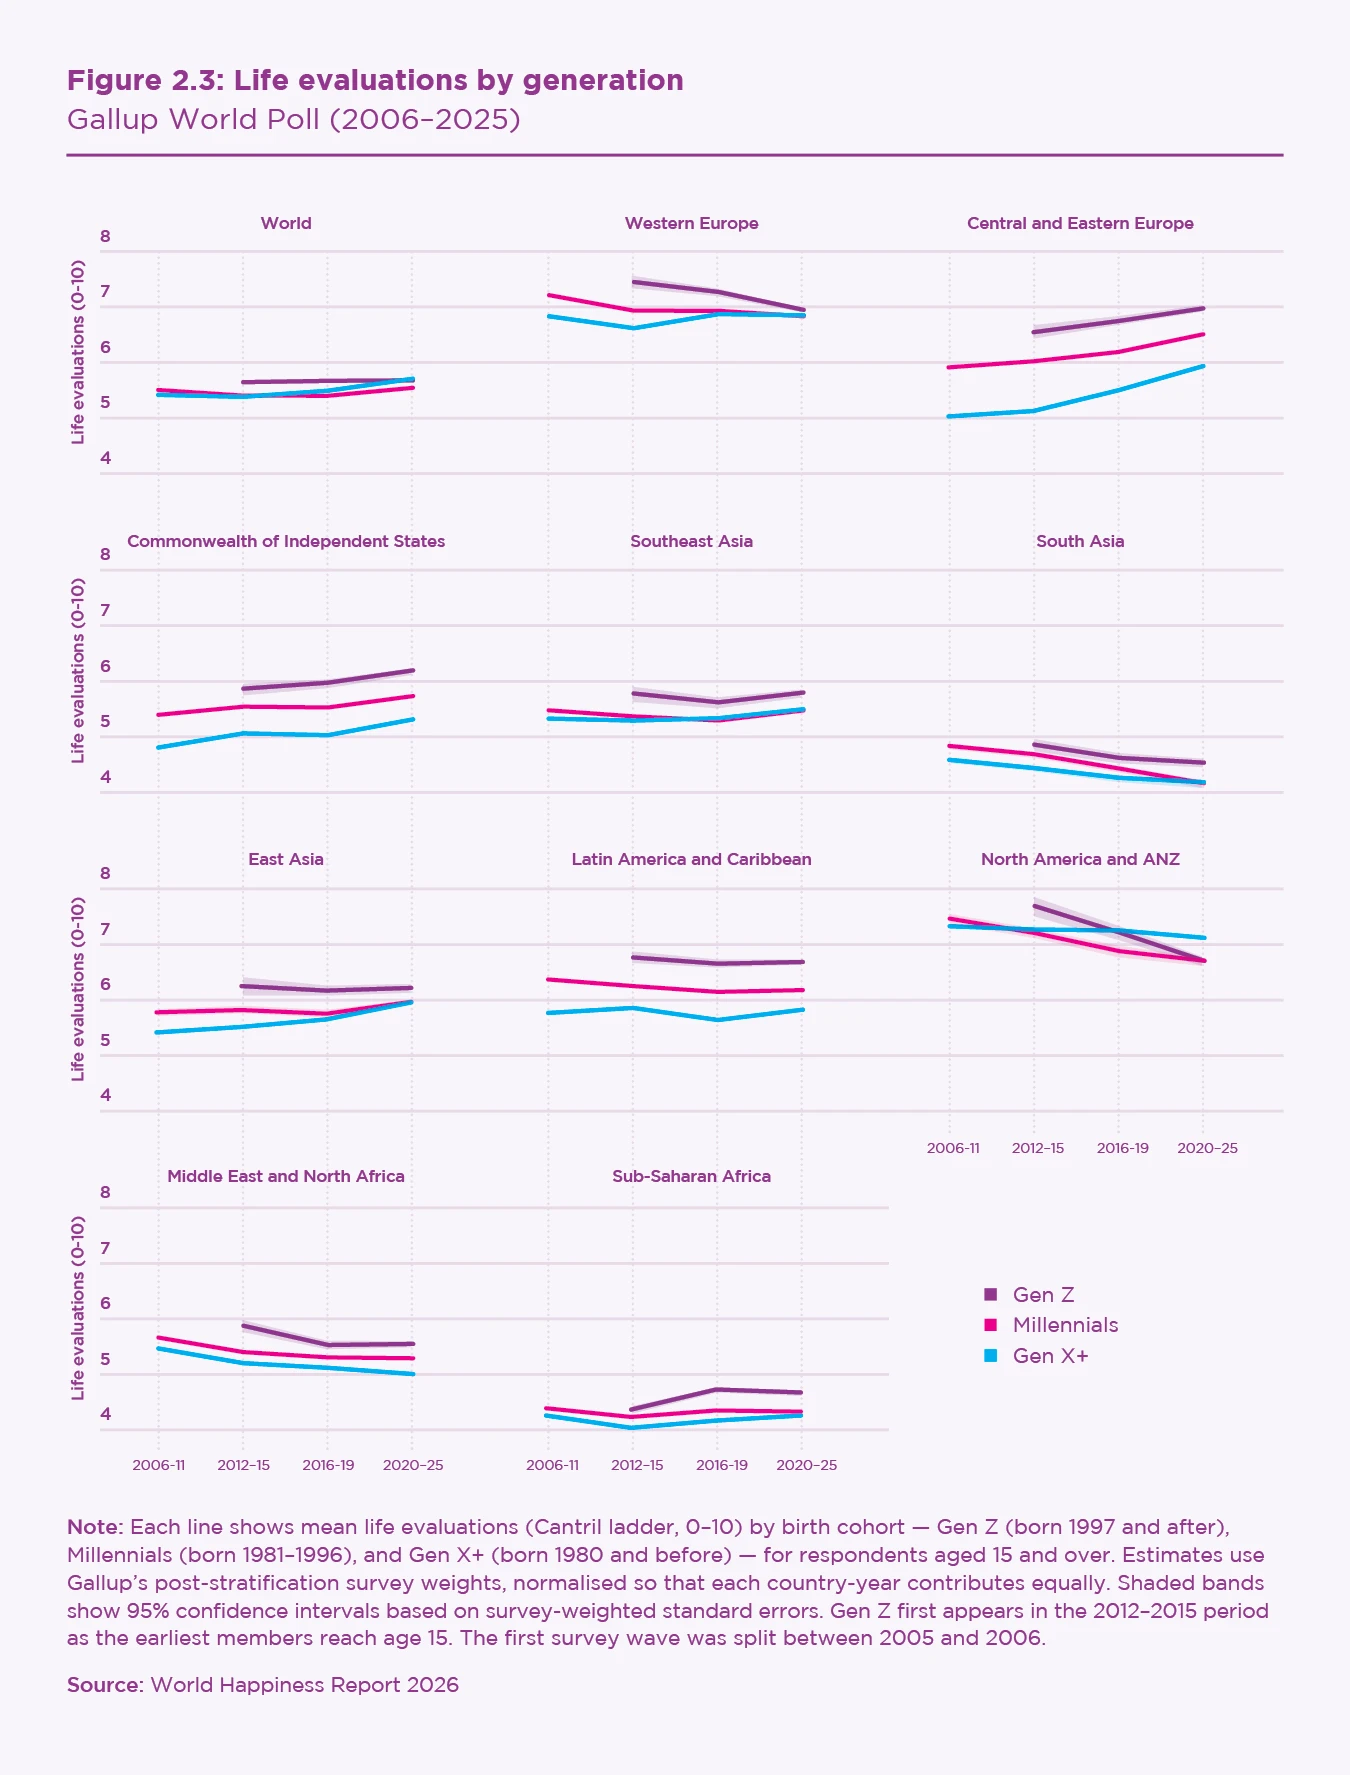
Figure 2.4 shows positive and negative affect for the three generations, for the world and by region. Because positive emotions are roughly twice as frequent as negative ones, it is possible to show both on the same figure, since they never intersect in any region.
The frequency of negative affect has been rising for all generations for the world as a whole, and in most regions. Gen Z has had the largest relative increases in negative affect in NANZ, Western Europe, MENA and Sub-Saharan Africa. NANZ provides the extreme example, where an initially large Gen Z advantage has disappeared entirely, with negative affect becoming significantly more frequent among Gen Z than Gen X+, and almost as common as Millennials. The shaded areas about the lines show the 95% confidence regions, which are broad enough to be easily visible only in the NANZ region, given the smaller number of countries and therefore respondents.
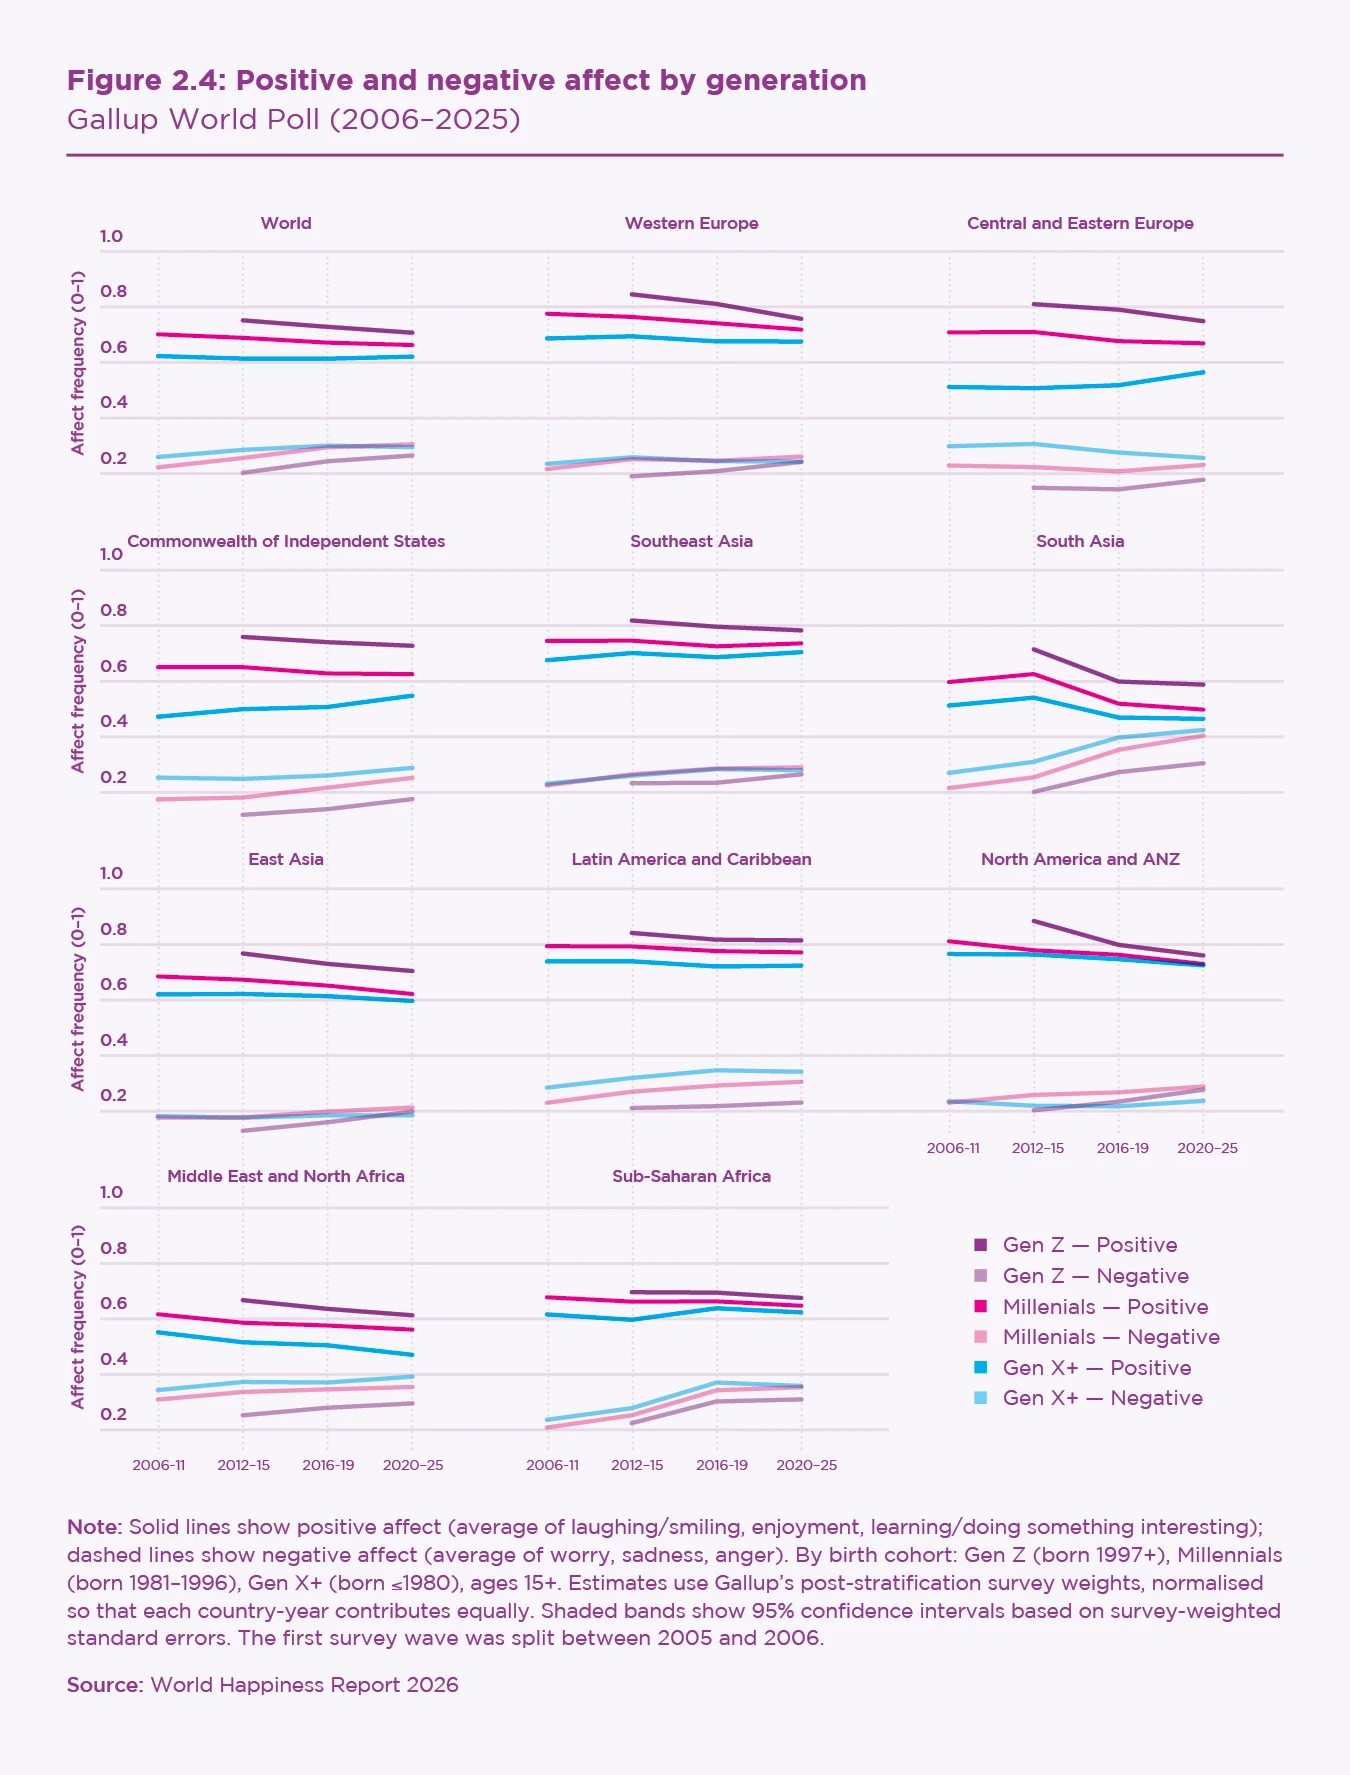
In all regions, positive affect is greater for Gen Z than for Millennials, who in turn have more frequent positive affect than do those born earlier. The advantage of Gen Z over earlier generations is largest in Central and Eastern Europe, and in the countries of the Commonwealth of Independent States (CIS). In Central and Eastern Europe, the positive experience gap favouring Gen Z over Gen X+ has shrunk by almost half, with more positive experiences for the old and fewer for Gen Z.
Once again, the NANZ region is exceptional. It is the only group of countries where the positive emotions advantage has disappeared.
Gender differences in youth wellbeing
In our WHR 2015 analysis of gender differences, using data from 2006–2014, we found life evaluations to be slightly higher for females, on average. Some negative emotions, including worry and sadness, but not anger and stress, were significantly greater for females than males.[45] Reports of pain on the previous day were similar for young males and females, but more frequent for females than males at older ages.[46]
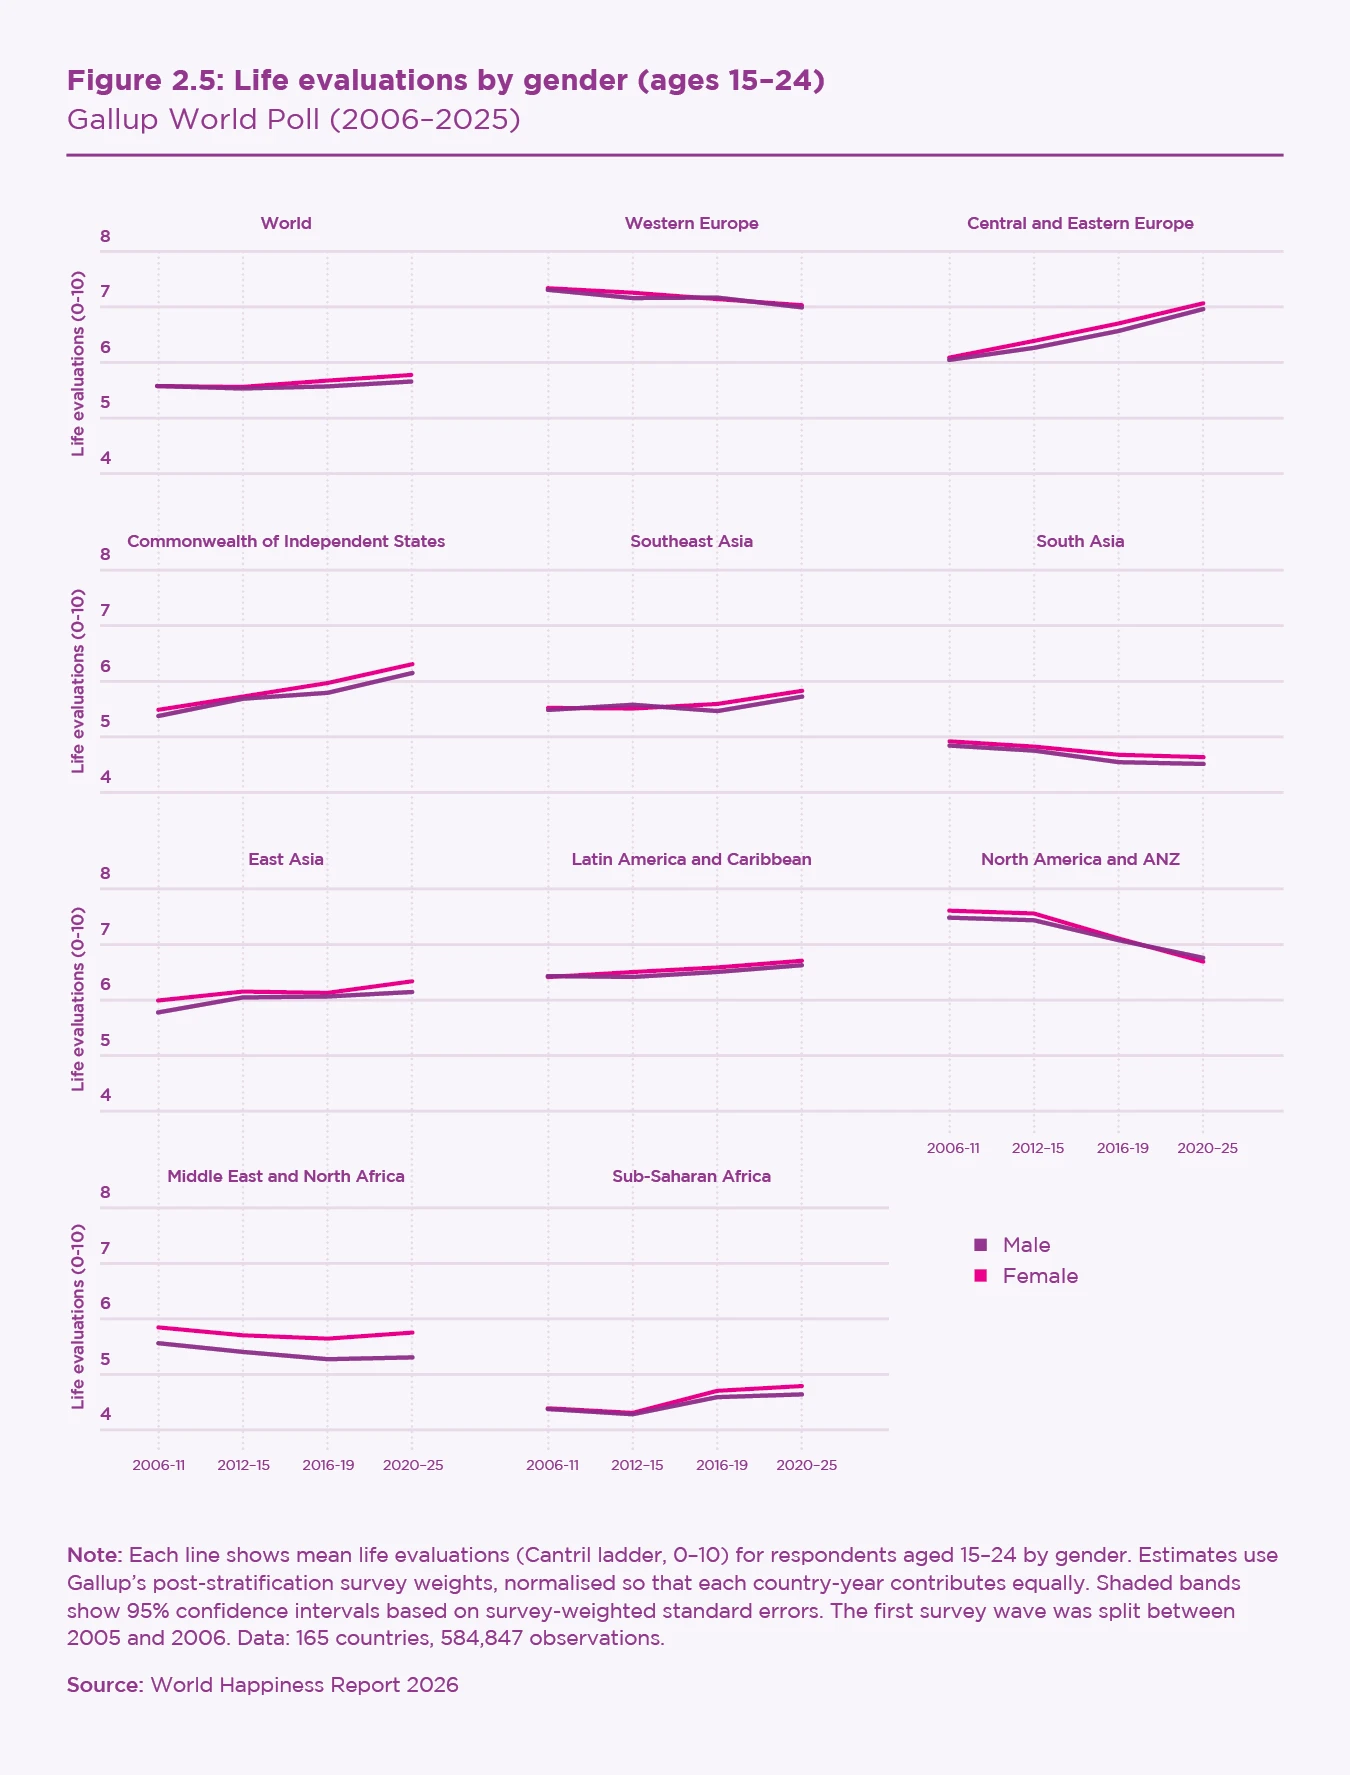
We now have another ten years of data, and can assess the extent to which gender differences have been changing. We concentrate on changes for those aged 15–24, since younger users have been the primary focus of social media research.[47] Figure 2.5 shows life evaluations separately for males and females aged 15–24 in four time periods for the world and by region. In general, the very small female advantage has become slightly larger in more recent years. For Europe and Sub-Saharan Africa, there are no significant gender differences before or after 2012, the year we use to mark the widespread uptake of smartphones. In Southeast Asia and Latin America, there was gender equality in the early years with a slight female advantage appearing in the more recent period. In the Middle East and North Africa, an initial female advantage has become larger in more recent years. In the NANZ region, life evaluations for both genders have fallen dramatically since 2012, with the drop being slightly larger for females than males. Young females in those countries are now slightly less satisfied with their lives than young males. This makes NANZ the only world region in which young females are now reporting lower life evaluations than males.
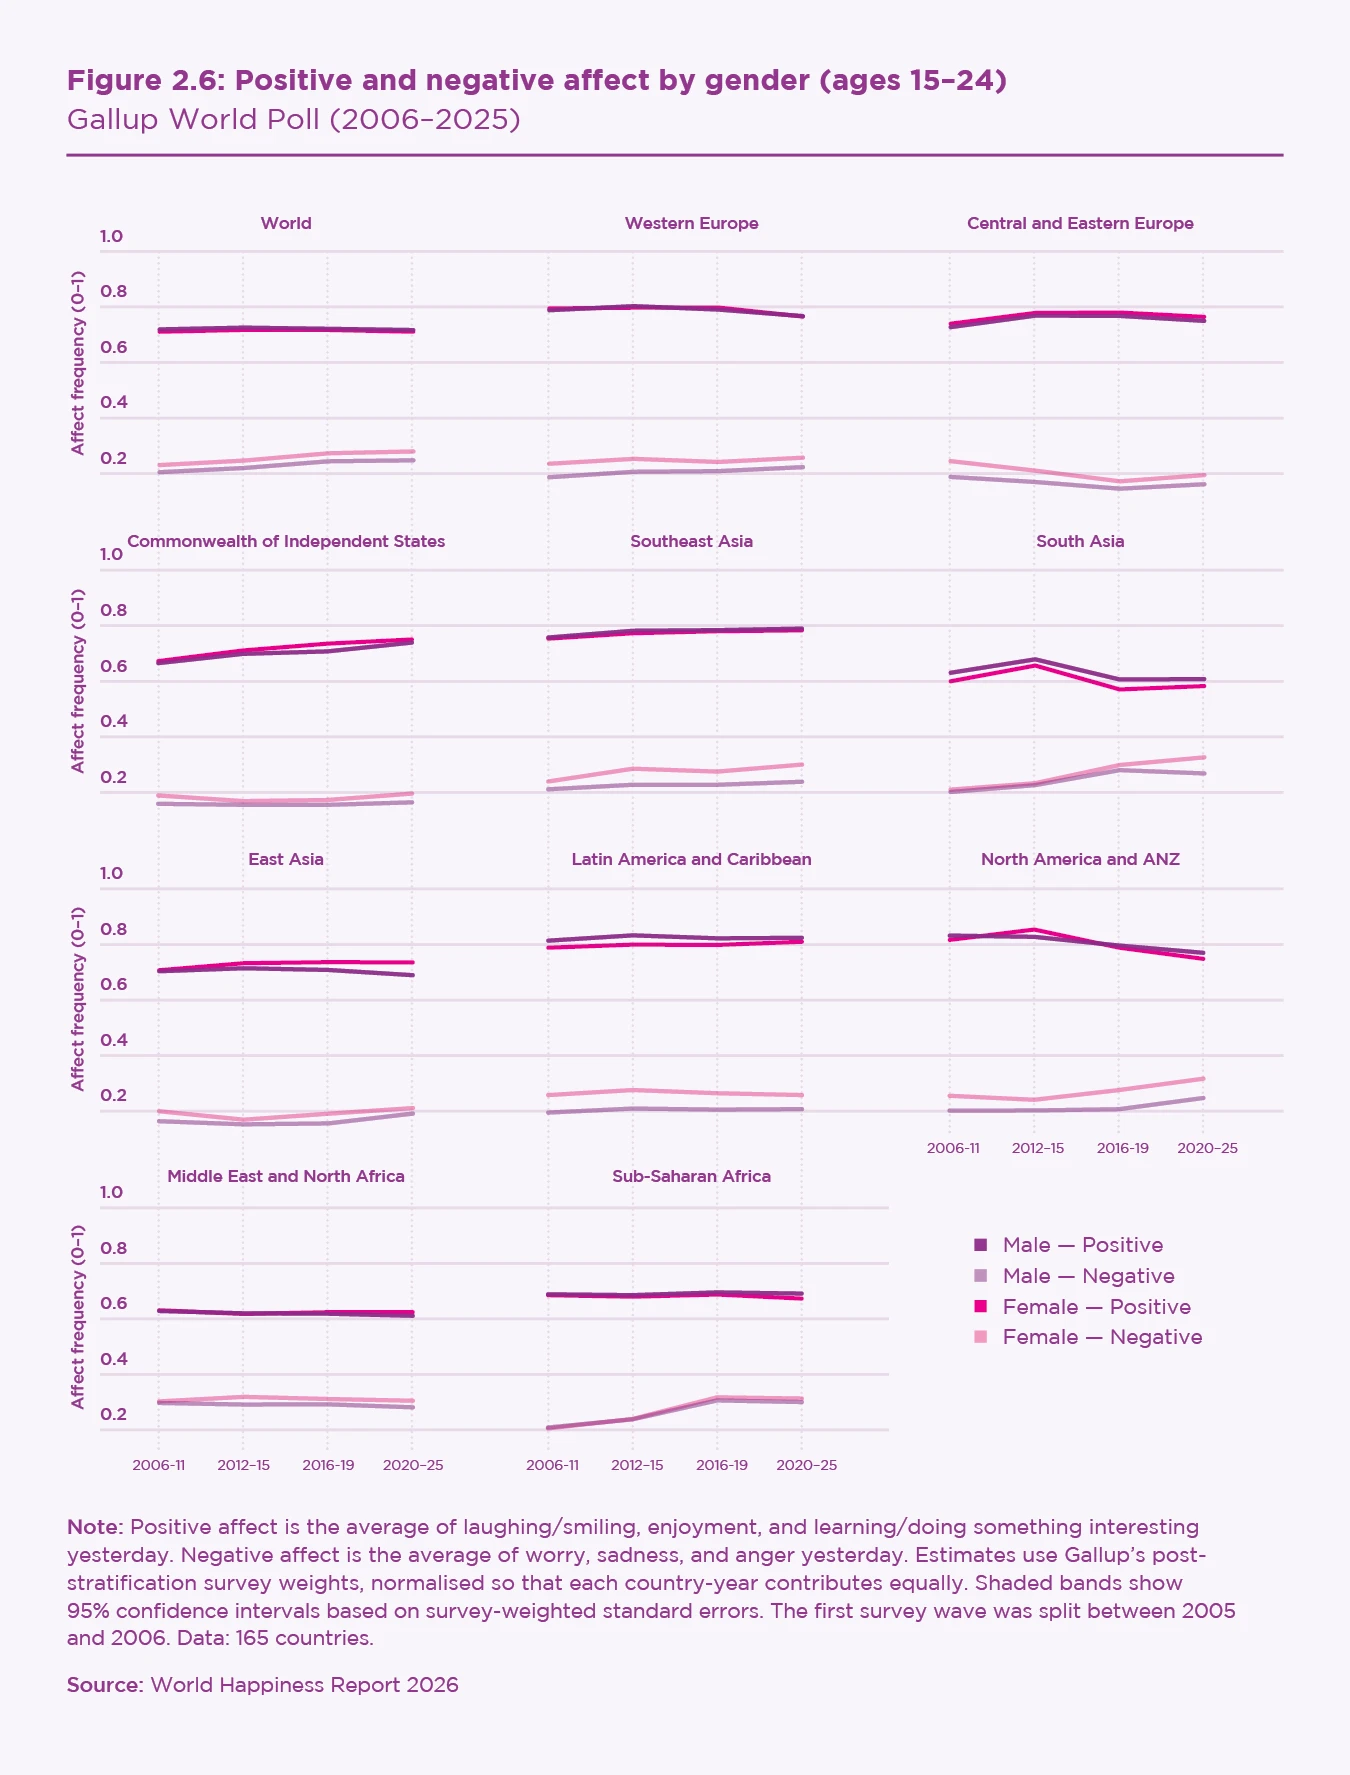
What about gender differences in emotions? Negative emotions have been a central focus of social media research, so we consider them first. As shown in Figure 2.6, negative emotions tend to be more frequent for females than males. Only in the NANZ region has this difference become significantly larger since the mid-2010s.
Positive emotions are more than twice as frequent as negative emotions for the young in all global regions, and are generally the same for males and females. Positive emotions are slightly more prevalent for males than females in South Asia, East Asia, and Latin America, with the latter two gaps disappearing in recent years. Only in the NANZ region has a gender gap favouring males appeared.
In summary, life evaluations and emotions all show a distinct pattern of decline in the NANZ region, especially for females.
Links between social media and happiness
To what extent can the diverse global patterns of youth happiness shown above be linked to changes in the extent and nature of social media use? Especially so in the United States, Canada, Australia, and New Zealand, where the most dramatic declines have taken place.
There are two Gallup World Poll questions that might help answer these questions. First, we have data since 2017 asking if respondents have a mobile phone that can be used to access the internet (cellphone access). This is not a direct measure of social media use, but does provide internationally comparable data showing trends in social media accessibility. Second, we have a more direct measure, from 2022 only,[48] when respondents were asked whether or not they have used any social media in the past 30 days (social30). These binary variables speak to internet access, but do not measure either the extent or the nature of social media use.
Figure 2.7 shows the data for both variables averaged for the world and each region, for those aged 15–24 and those aged 25 and older.[49] The sharp rise in 2020 in some regions is due to a COVID-19-induced shift from in-person to phone interviews by the Gallup World Poll. There is no corresponding jump in Western Europe and the NANZ group, because these countries were surveyed by telephone throughout the whole data period.
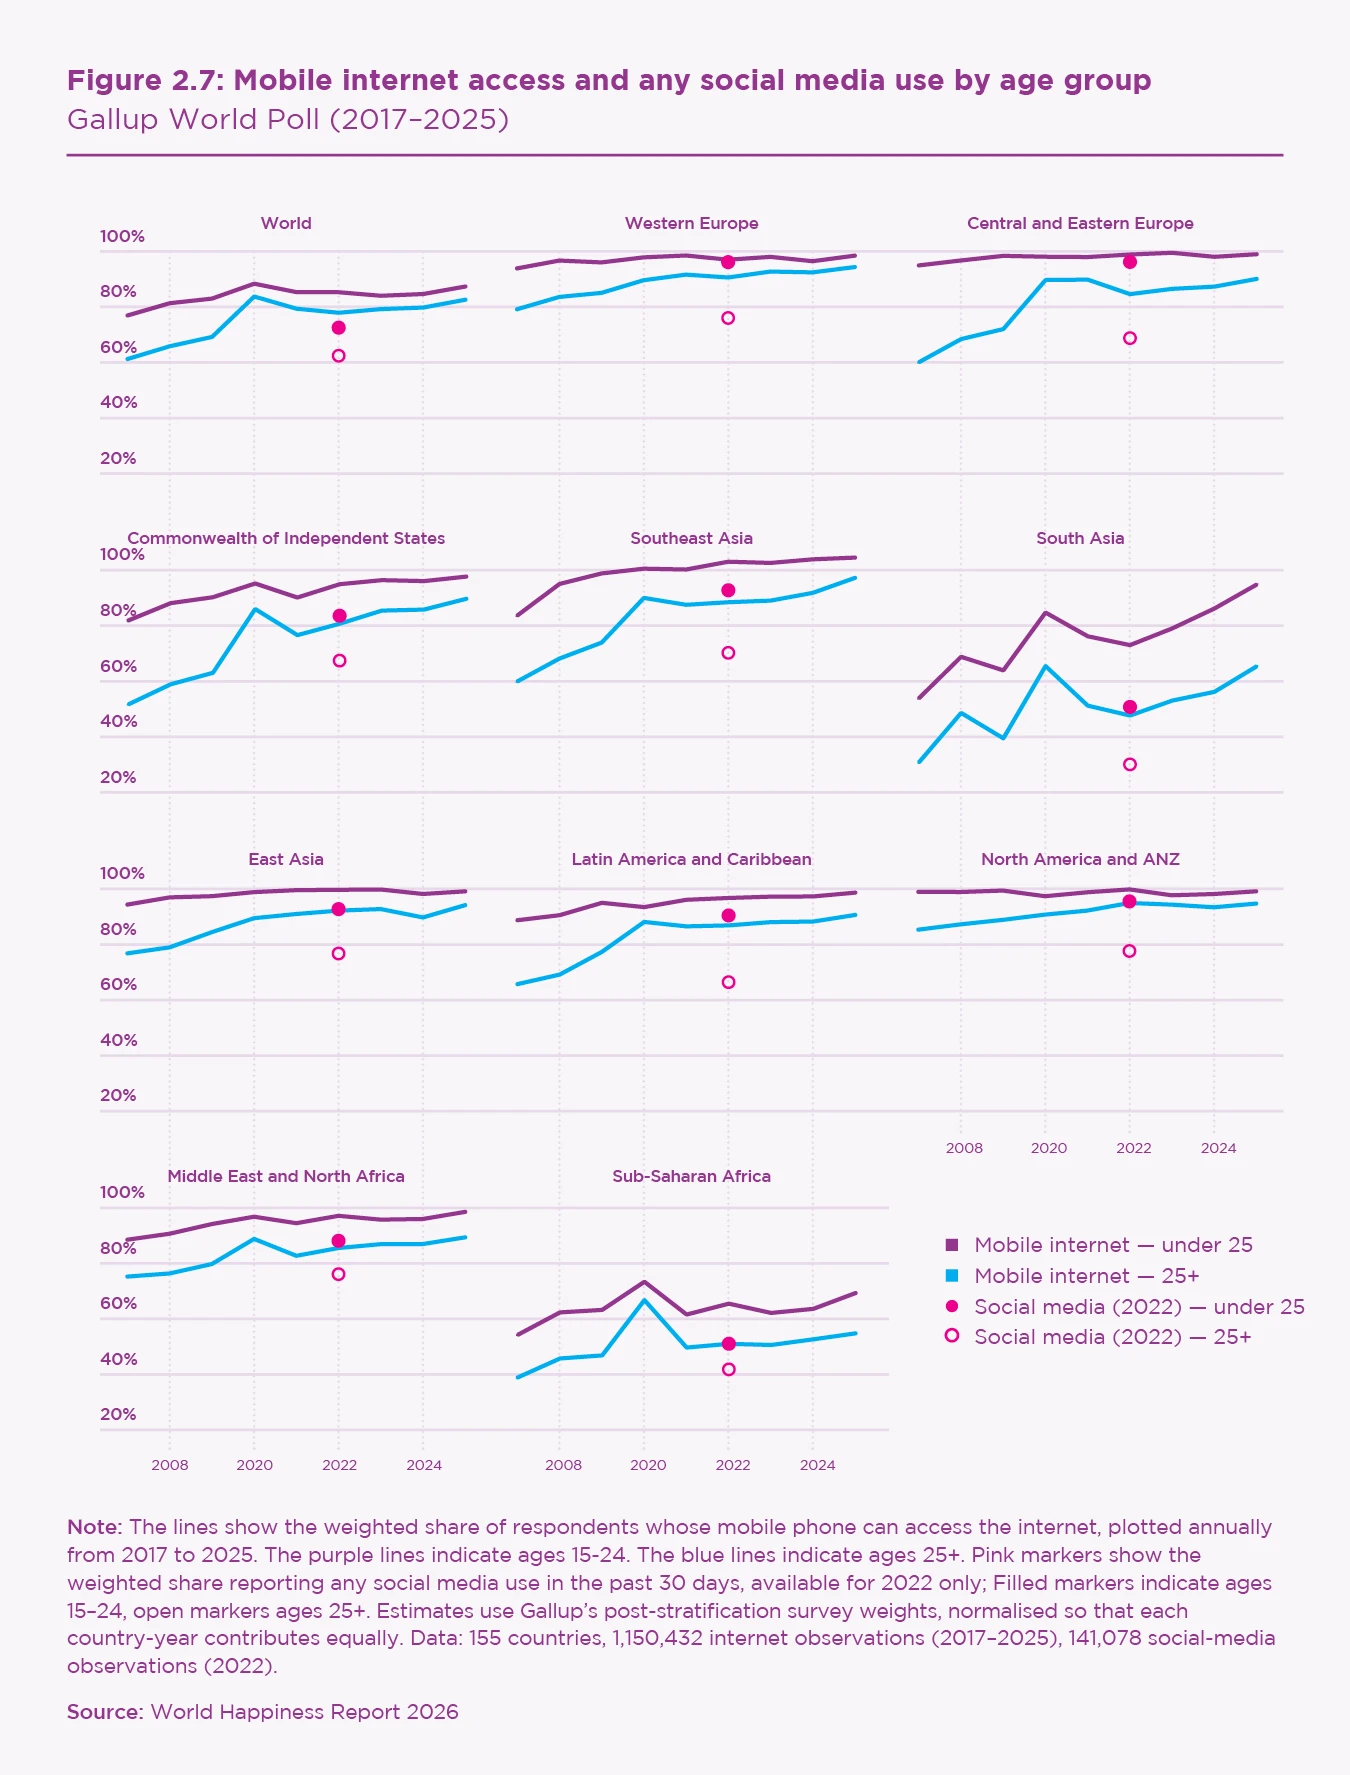
Figure 2.7 shows that cellphone access to the internet and any social media use in the previous 30 days are higher for those under 25 in every global region. For cellphone access, the trend is upward for both age groups, with a narrowing gap between the young and the rest of the population in every region, approaching equality in Western Europe.
Especially striking in Figure 2.7 is that cellphone access and any social media use in 2022 display consistent and almost identical patterns. The regional differences in 2022 are very highly correlated (r = +.945, n = 10). That very high association carries over even among the 140 countries (r = +.938, n = 140).
To what extent do these different trends correspond to the sharp international differences we find for the levels and changes in youth wellbeing? In Figures 2.2 through 2.6, we presented data showing exceptionally large drops in life evaluations and increases in negative emotions in the NANZ region. These countries are also ones where social media use among the young has reached the highest levels, as shown in Figure 2.7. Is the correlation between increased social media use and decreased happiness in NANZ replicated elsewhere in the world?
In Table 2.2, we compare life evaluations and negative affect for under-25s in 2020–2025 with those in 2006–2011. Social media access on smartphones is assumed to have been zero, or at least negligible, everywhere in 2006–2011.[50] Changes in life evaluations and negative emotions from then to now can be matched to recent levels of cellphone access to the internet and any social media use in 2022. We show NANZ and Western Europe, the two regions that have been most studied in social media research, plus Latin America, where we also have data for social media use on different platforms. We also include the UK and Ireland as a separate group to see how the changes in the four countries of NANZ (speaking mainly English) compare to the two English-speaking countries of Western Europe.
| NANZ | Western Europe | UK/Ireland | Latin America | Comparisons to NANZ | |
|---|---|---|---|---|---|
| Ladder baseline (2006–2011) (SE) | 7.542 | 7.309 | 7.33 | 6.403 | |
| (0.040) | (0.020) | (0.064) | (0.016) | ||
| Ladder change (2020–2025) (SE) | -0.812*** | -0.312*** | -0.416*** | +0.264*** | vs. W.Eur: -0.500*** vs. UK/Ire: -0.396*** vs. LatAm: −1.076*** |
| (0.059) | (0.029) | (0.095) | (0.026) | ||
| Negative affect change | +0.051*** | +0.031*** | +0.064*** | +0.006 | vs. W.Eur: +0.024 vs. UK/Ire: −0.009 vs. LatAm: +0.049*** |
| (0.011) | (0.005) | (0.017) | (0.003) | ||
| Technology adoption — Youth in 2022 | |||||
| Mobile internet | 0.991 | 0.950 | 0.883 | 0.852 | Range: 85–99% |
| Social media (30d) | 0.955 | 0.960 | 0.997 | 0.903 | Range: 90–100% |
Note: *** p < 0.001, ** p < 0.01, * p < 0.05. Estimates use Gallup’s post-stratification survey weights, normalised so that each country-year contributes equally. Survey-weighted standard errors. Baseline: 2006-2011; Recent: 2020-2025. The first survey wave was split between 2005 and 2006. Comparisons show the NANZ change minus the other region’s change. N (baseline / recent): NANZ 2,216 / 1,968; W. Europe 9,428 / 8,807; UK/Ireland 1,330 / 800; Latin America 26,139 / 18,808. Mobile internet access: NaN coded as 0 (not asked = no mobile internet access).
In NANZ, life evaluations for under-25s fell by nearly three times as much as Western Europe, and more than twice as much as the UK and Ireland. Over the same time period, life evaluations for under-25s in Latin America grew significantly. Yet, cellphone access to the internet and social media use in the last 30 days became almost universal in all four groups. Thus, social media may be doing more harm to young lives in NANZ than elsewhere or the social media effects are dwarfed by other underlying factors, or perhaps some combination. The negative affect differences are less marked and need unbundling to separate the differing movements of their three components: worry (akin to anxiety), sadness (akin to depression), and anger. This is done in Table 2.3.
| Worry change | Sadness change | Anger change | Negative affect change | |
|---|---|---|---|---|
| NANZ | +0.102*** | +0.093*** | +0.031* | +0.055** |
| Western Europe | +0.082*** | +0.038*** | +0.028*** | +0.031** |
| Latin America | +0.042*** | +0.000 | +0.024*** | +0.006 |
| NANZ vs. W. Europe | +0.020 | +0.055*** | -0.003 | +0.024 |
| NANZ vs. LatAm | +0.060*** | +0.093*** | -0.006 | +0.049*** |
| Pattern | Similar increases everywhere | NANZ distinctive (depression- related) | Similar decreases everywhere | Modest increases (anger offsets) |
Note: *** p <0.001, ** p < 0.01, * p < 0.05. Estimates use Gallup’s post-stratification survey weights, normalised so that each country-year contributes equally. Survey-weighted standard errors. Baseline: 2006-2011; Recent: 2020-2025. Comparisons show the NANZ change minus the other region’s change. N (baseline / recent): NANZ 2,196 / 1,967; Western Europe 9,176/8,768; Latin America 25,805 / 18,815.
The recent emotions data include 2020–2025, so the common experience of the COVID-19 pandemic may help to explain the similar increases in worry in all groups, rising from 32% to 42% in NANZ and Western Europe, and from 31% to 38% in Latin America.[51] Sadness is quite different, rising from 15% to 25% in NANZ, but only from 14% to 17% in Western Europe, and remaining unchanged at 19% in Latin America. The prevalence of anger fell significantly in all three regions, by very similar amounts.
Table 14 of the online statistical appendix shows some of the results from including cellphone access in a global equation covering 2017 to 2025 for individual responses to the Cantril Ladder question. The coefficients on the control variables, which include demographic variables plus the individual equivalents of the six variables used in Table 2.1 to explain international differences in wellbeing, are constrained to be the same in all regions, with a separate cellphone access coefficient estimated for each region. For social media use, we have data only from 2022, when respondents were asked, yes or no, if they had used any social media in the previous 30 days. The smaller sample size means that the confidence regions are much larger for the social media coefficients. The NANZ region is an outlier for the estimated links between the Cantril Ladder and any social media use in 2022 and cellphone access to the internet (2017–2024). The netphone coefficients, which are based on much larger samples, are positive in every global region except NANZ. If Western Europe is split into an English-speaking pair (the UK and Ireland) and the rest of Western Europe, the netphone coefficient is significantly negative there as well, although much less so than in the NANZ countries. The social30 coefficients, based only on 2022 data, have larger estimated confidence regions, but are significantly positive in five regions. Only in NANZ is there a significant negative coefficient for having had any social media use in the previous 30 days in 2022.[52]
It is remarkable how closely matched are the coefficients for any social media use in 2022 and for cellphone access to the internet (r = +0.93), despite the different sample periods and question content. Cellphone access to the internet is a measure of how easy it would be to access social media in typical ways, but does not reveal actual social media use. The closeness of the two coefficients in all regions increases our confidence that cellphone internet access provides a reasonable population-level proxy measure for at least some level of social media use.
The NANZ results reflect the fact that life evaluations of the young in those countries are lower than those of the older populations for reasons not captured by the control variables. For all other regions, cellphone access to the internet and any social media use in 2022 are associated with higher life evaluations. If the equation is fitted for the life evaluations of all those living outside the NANZ countries, the positive netphone coefficient is larger than the negative coefficient for NANZ. Thus, for a typical country, the association between life evaluations and cellphone access is substantially positive, by about a quarter of a point on the 0–10 life evaluation scale.
Subjective wellbeing of the young has fallen dramatically since 2011 in the United States, Canada, Australia, and New Zealand, with very limited evidence of corresponding changes elsewhere.
As we have already noted, this does not imply that all social media platforms have positive associations, since cellphone access can also be used for communication-based platforms such as Zoom and FaceTime. For typical respondents outside NANZ, those with cellphone access to the internet were more satisfied with their lives than those who did not, on average. This result is unlikely to be driven by the higher incomes and education levels of the internet users, as both variables are controlled for.[53]
There are two main conclusions from our investigations thus far. The first is that we have confirmed our 2024 finding that subjective wellbeing of the young has fallen dramatically since 2011 in the United States, Canada, Australia, and New Zealand, with very limited evidence of corresponding changes elsewhere. The second is that we cannot use cellphone access and any social media use data to explain the wellbeing linkages of different types and intensities of social media and other uses of the internet. Both variables are almost equal to 100% for under-25s in every country by 2022. To link wellbeing trends more securely with data on social media requires survey evidence that can match wellbeing outcomes with the intensity of use of different internet activities and social media platforms.
Thankfully, we have found three quite different but complementary sources of data linking life satisfaction with the extent and pattern of social media use. First, we shall examine social media and other internet time-use data from 15-year-olds in the 2022 wave of the PISA survey.[54] Then, we will examine platform-specific data from the ENBIARE survey in Mexico and the Latinobarómetro in 17 Latin American countries.

Internet use, social media, and teenage life satisfaction in 47 countries
Figure 2.8 shows the number of weekday hours spent on seven internet activities, using data from a special module of PISA 2022. In Australia and the United States, data was collected for internet activities but not life satisfaction. Thus, there are 49 countries represented in Figure 2.8 but 47 in our life satisfaction analysis. Canada and New Zealand did not collect data on either internet activities or life satisfaction. The UK and Ireland are treated separately from Western Europe because they are the only English-speaking countries in the 47 PISA countries with life satisfaction data.
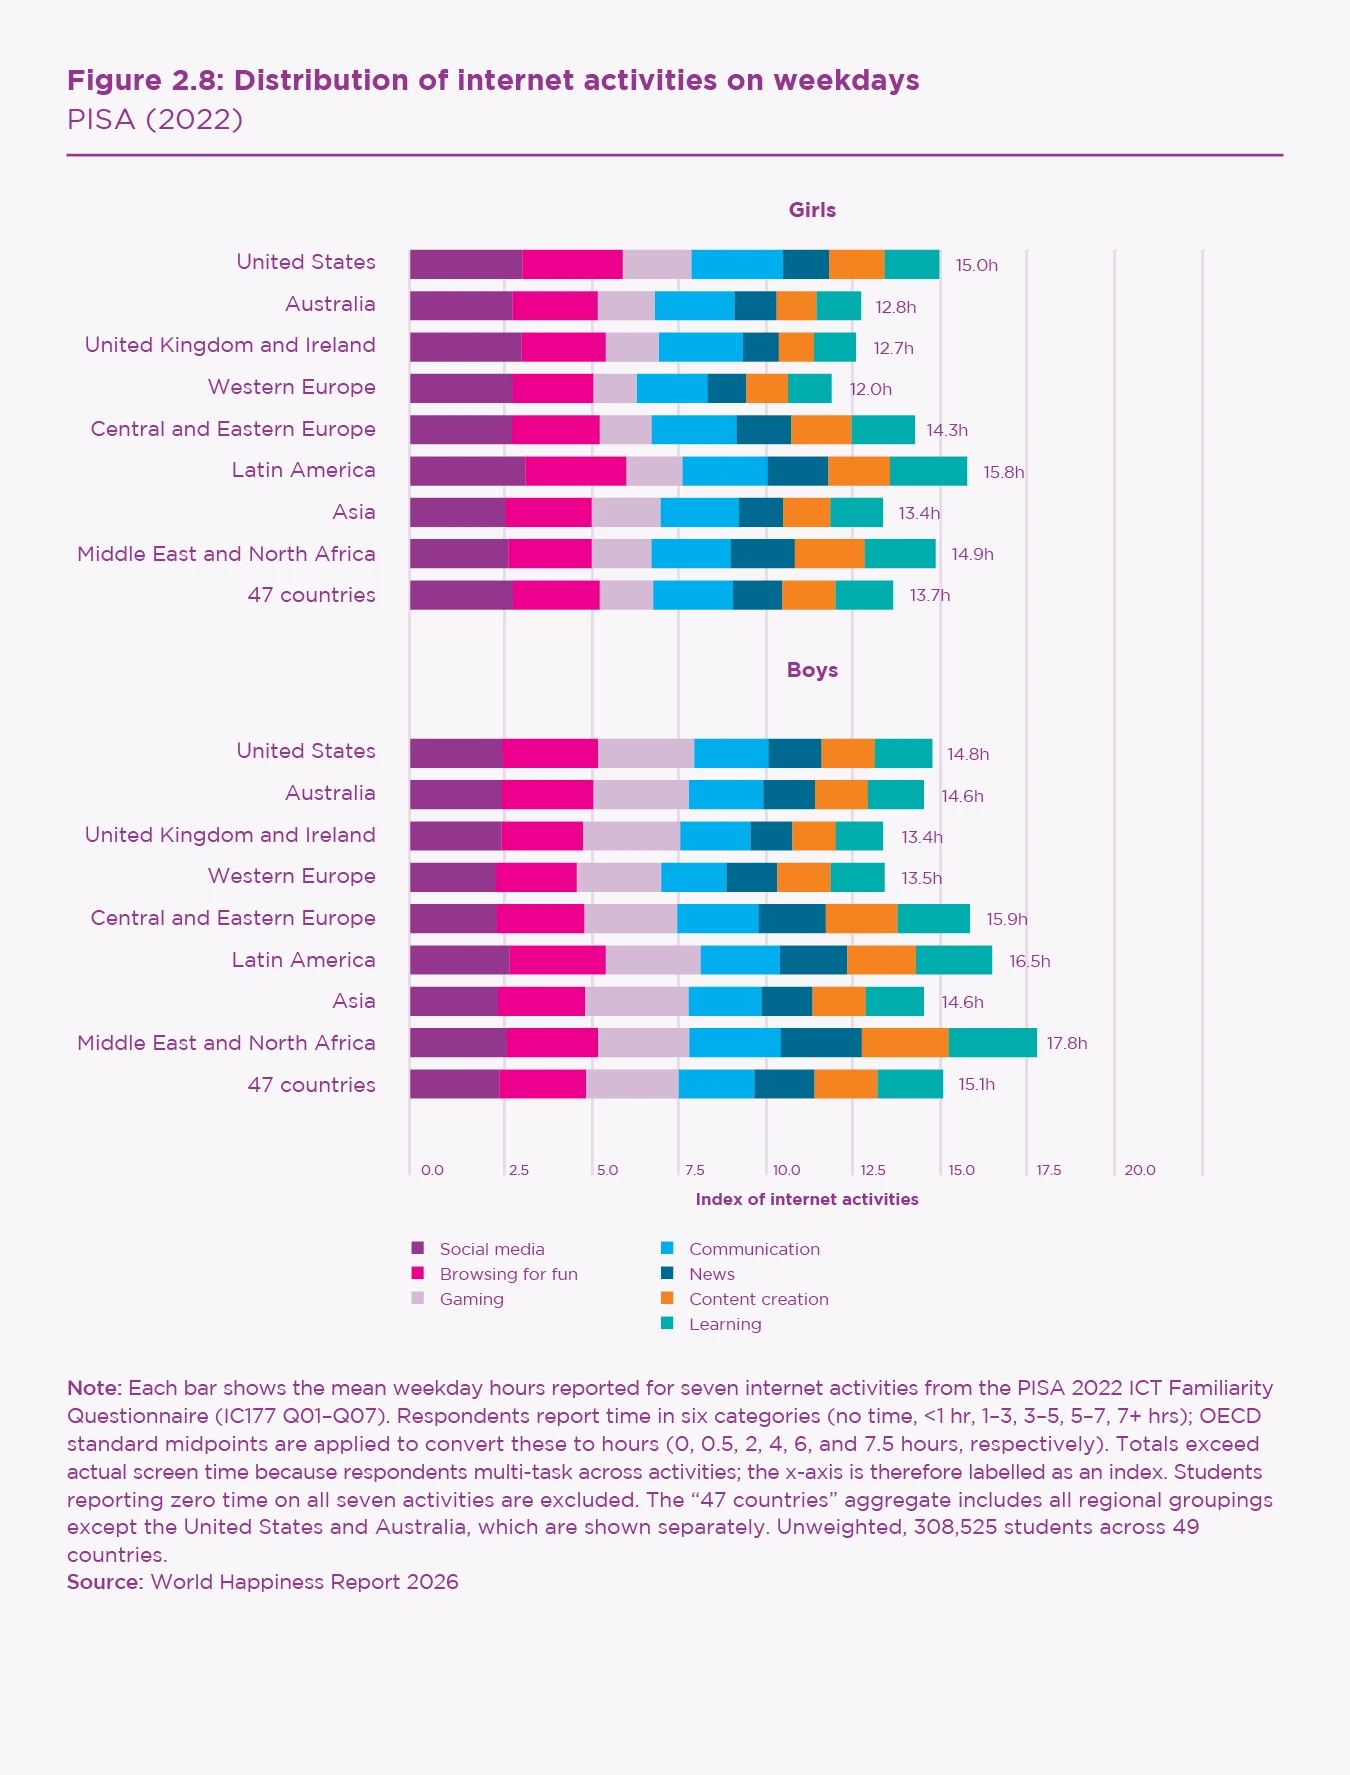
Figure 2.8 plots the sum of students’ self-reported hours spent on seven different digital leisure activities during a typical weekday. Because the activity categories are not mutually exclusive, the summed measure should be interpreted as an index of digital use intensity rather than a measure of exact time use. The social media category (the left-hand segment of each bar) is the variable used in Chapter 5. The distribution of activities is strikingly similar in each country and region. Across all countries, social media hours are higher for girls, and gaming hours are higher for boys. The sum of those two activities, combined with browsing the internet for fun, are very similar for boys and girls, and across countries and regions. Thus, international differences in patterns of internet use are unlikely to explain international differences in youth happiness, unless the linkages differ a lot among regions.
We describe the total as an index, rather than an estimate of actual hours devoted to each activity, since the totals are more than three times higher than answers about total leisure and learning uses of the internet asked elsewhere in the PISA survey. Respondents, like most internet users, often multi-task, covering many uses within the same hour. Since we are interested in the distribution of time across different uses, and since there is much focus on the social media category, both in this chapter and in Chapter 5, we continue to use these data even though we know their total hours, and the reported hours for specific uses, are too large. Hence the need to call the total an index rather than an estimate of actual total weekday hours of screen time.
Figure 2.9 plots average life satisfaction across all 47 countries against the average time spent on seven internet activities on weekdays. For both boys and girls, we observe a clear separation between two groups of internet activities. Group A includes social media use, gaming, and browsing for fun, while Group B includes news and information, content creation, learning, and communication. The drop in average life satisfaction at higher rates of use is greater for girls than for boys. For both genders, life satisfaction falls faster with greater use of Group A than Group B.

We have restricted our sample in Figure 2.9 to exclude the 2.6% of respondents who do not report any use of the internet. Thus, all of those whose life satisfaction is shown in Figure 2.9 are internet users. For those who reported no weekday social media use, two thirds did use the internet for other purposes, and are shown as ‘none’ in our figure. The shape of the curves in Figure 2.9 suggests that low-level users have higher life satisfaction than non-users, while higher levels of use are associated with lower average levels of life satisfaction, especially for girls, and for users of social media, gaming, and internet browsing.
Figure 2.10 simplifies the material in Figure 2.9 by plotting separate lines for the two groups of activities. For both boys and girls, the peak of average life satisfaction is in the <1 hour range for Group A, and in the 1–3 hour range for Group B. As usage increases, the line for Group B is almost flat for boys, while falling for girls. The line for Group A drops with higher usage for both boys and girls, faster for girls than boys.
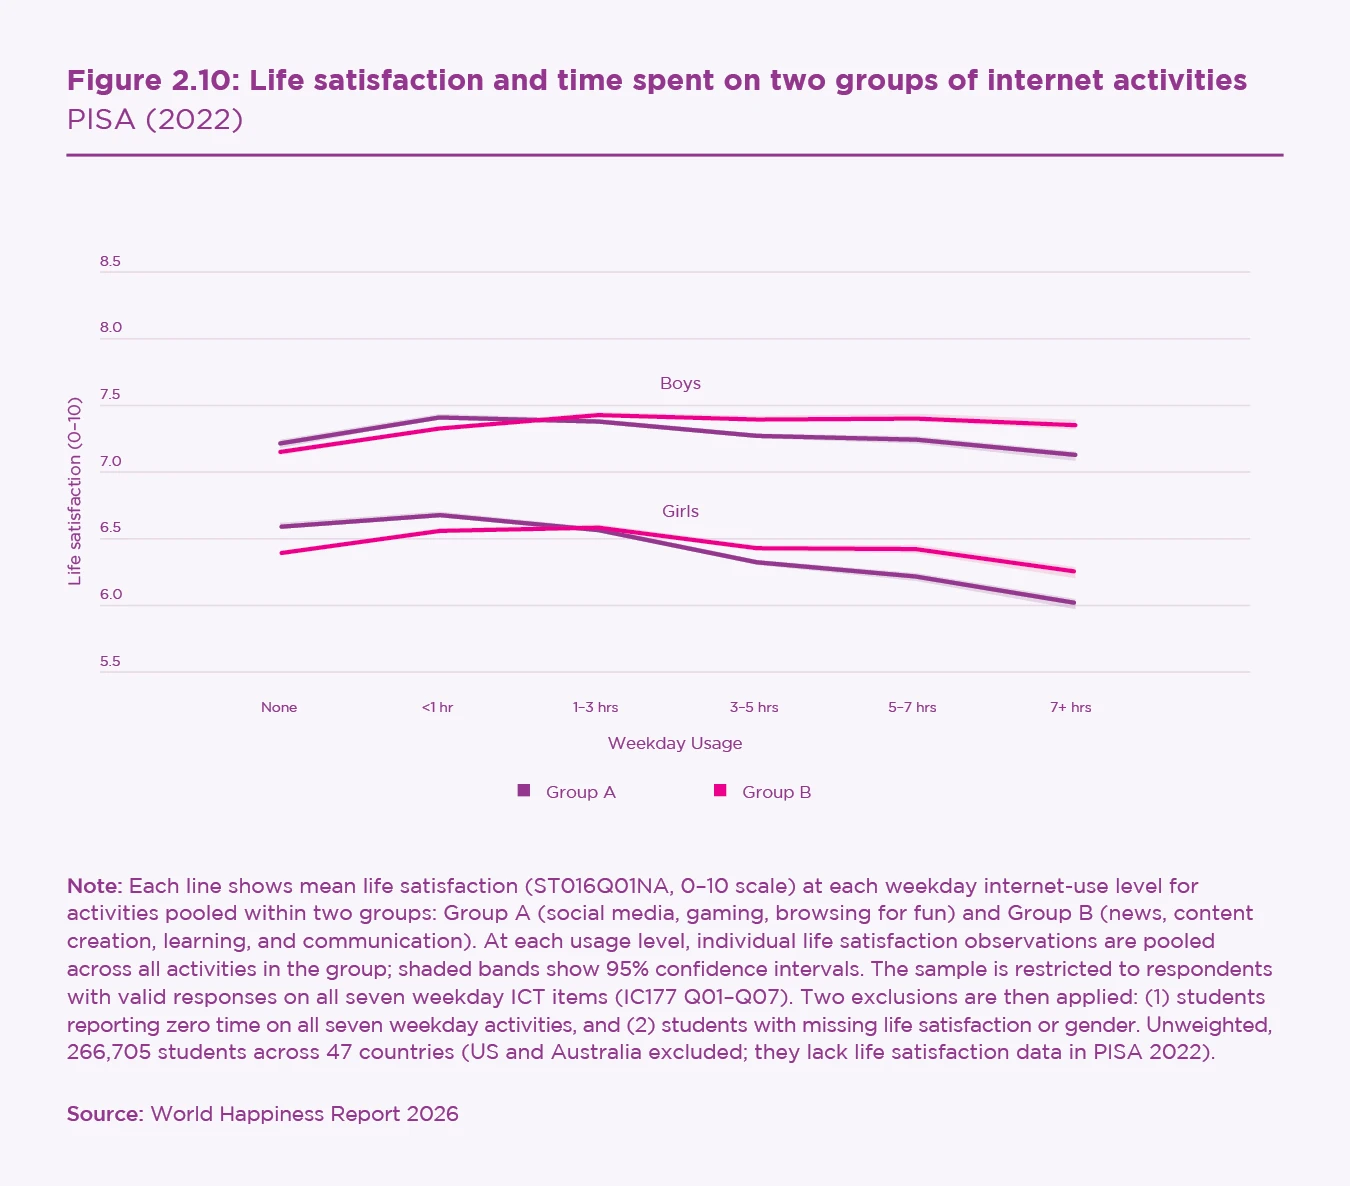
These data reflect simple correlations, and we make no causal claims. How might these patterns change if we were able to account for the contrasting possibilities that happier people will be more likely to use the internet, and that unhappy people might turn to the internet as a substitute for the real-life friends and activities they do not have? If happy people are more likely to make some use of the internet, that would shift the curves, without any obvious link to the rate of internet use. If already unhappy people are more likely to turn to social media, greater unhappiness is likely to be associated with high levels of internet use. This logic would suggest that accounting for the possible feedback loop between unhappiness and the extent of social media use would lessen, rather than increase, the steepness of life satisfaction declines associated with greater use of social media.
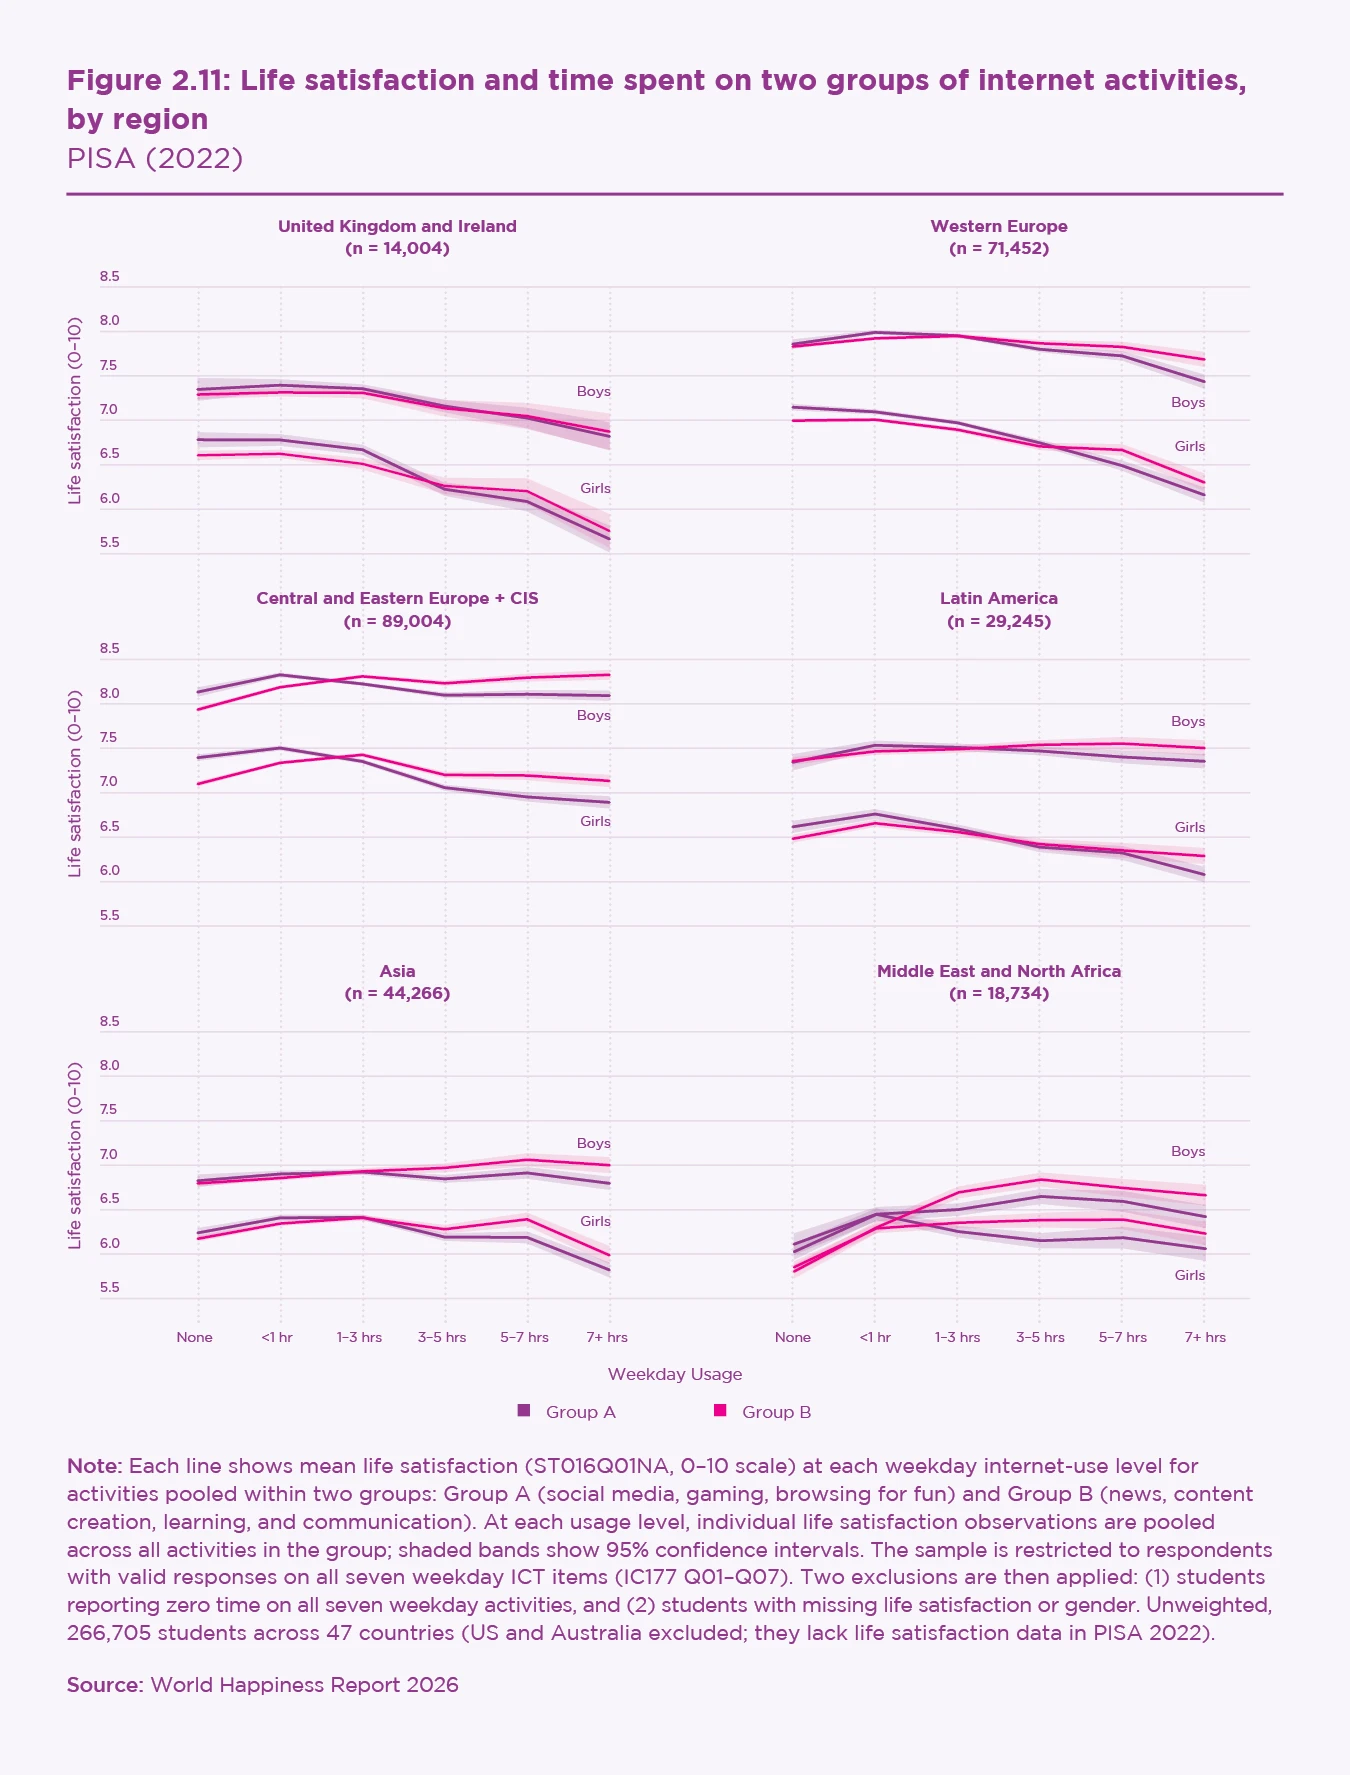
In Figure 2.11, we divide the 47 countries into six regions. There is much in common across regions, with Group A (social media, gaming, and browsing for fun) above Group B (communication, news, learning, and content creation) at low levels of use, and then falling below at high rates of use. This suggests that social media, gaming, and browsing for fun may be beneficial at low levels of use, and become increasingly harmful as time spent increases beyond some level. In all regions, the declines are steeper for girls than boys. They are also steeper in the UK and Ireland, and the rest of Western Europe, with the same slopes in both cases, although life satisfaction is generally lower in the English-speaking pair than elsewhere in Western Europe. In all regions, girls report significantly lower life satisfaction than boys, a finding that is not matched by data from the Gallup World Poll. Other research shows that the age of 15 is when female life evaluations are lowest relative to boys, with the gap closing thereafter.[55]
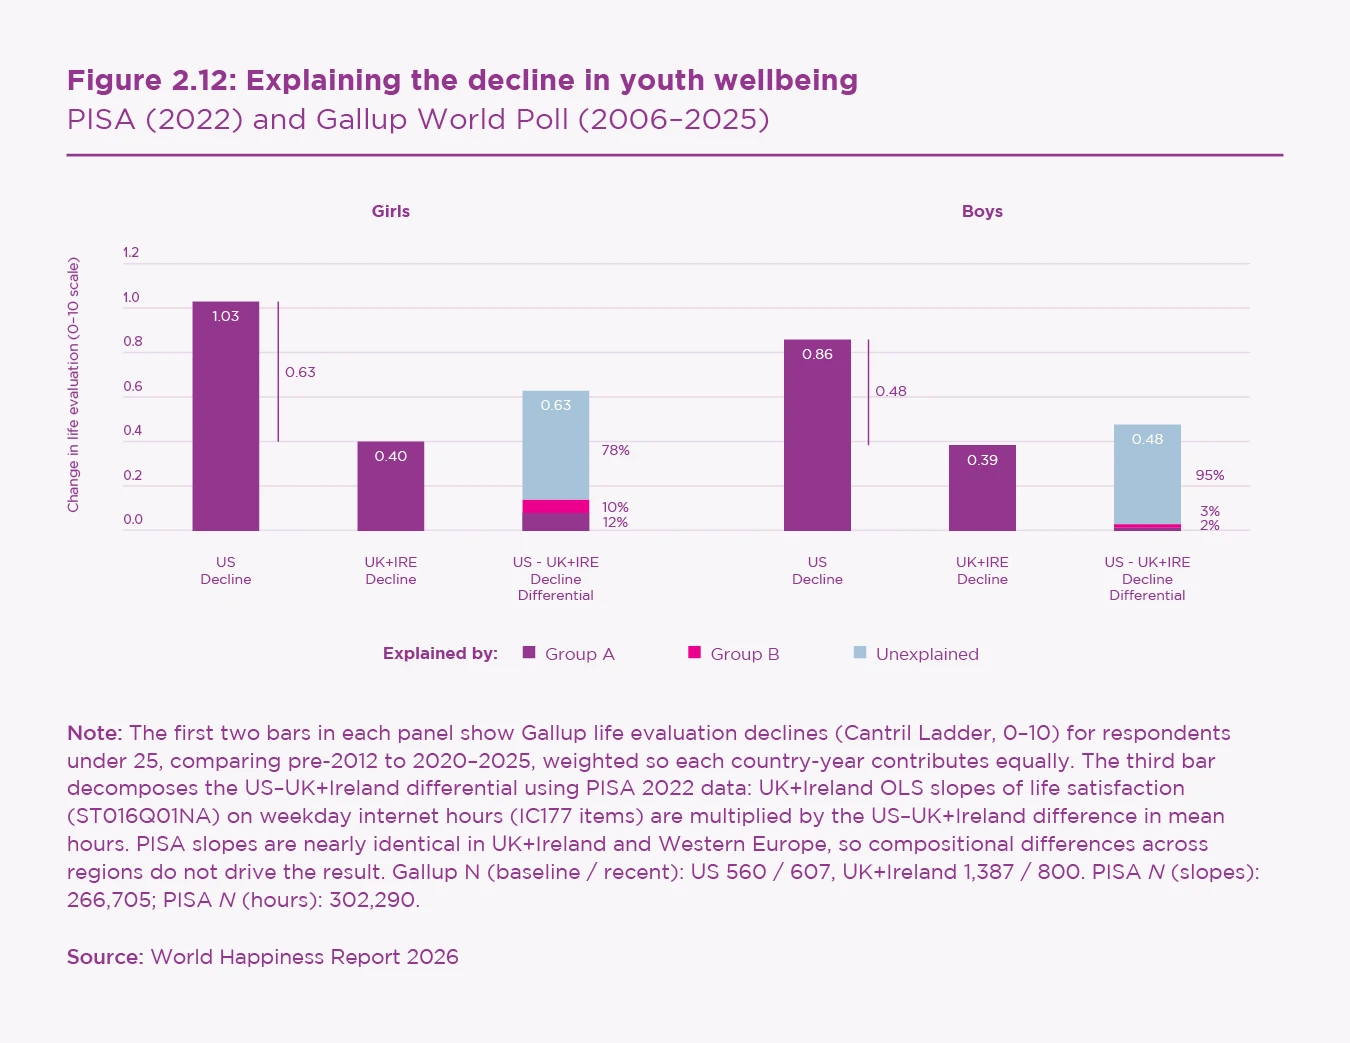
To what extent do these different patterns of social media and internet use help to explain wellbeing drops that are far higher in the United States than in the UK and Ireland, and somewhat higher in the UK and Ireland than in the rest of Western Europe? We can measure rates of use in the three regions, and they are very similar. We cannot estimate the slopes for the United States, since the life satisfaction question was not asked there in PISA 2022. So we use the UK and Ireland slopes instead, which are similar to those in the rest of Western Europe. Thus, when we calculate the amount that higher US usage explains the greater US falls, it explains only 8% of the difference for girls and 5% for boys, as shown in Figure 2.12.
Unfortunately, since none of the four NANZ countries asked the life satisfaction question in PISA 2022, we have to employ indirect means to harness the PISA and other data to explain the large NANZ decline. There are two English-speaking countries in the PISA data. It is reasonable to ask if the large drops in the NANZ countries, which are all mainly English-speaking, might be due, at least partially, to social media platforms being used differently in other cultures, with language providing a natural boundary for culture and content.
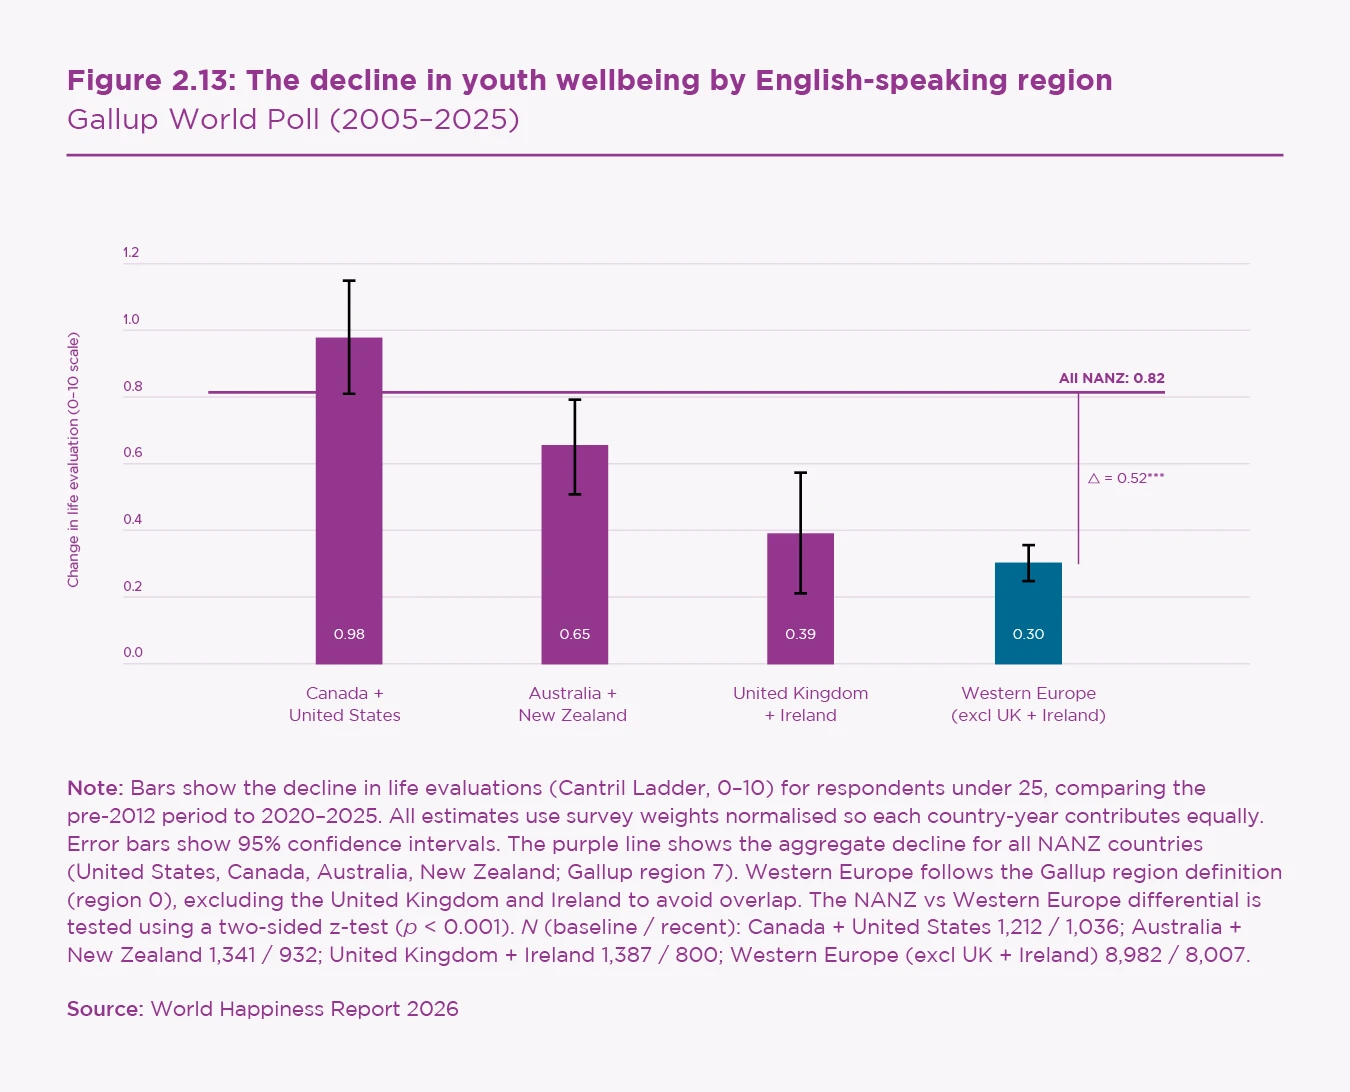
Figure 2.13 splits the six English-speaking countries into three groups of two, separated by geography but mainly sharing a common language. The life evaluation drops have been significantly larger in Canada and the United States than in Australia and New Zealand, with both drops being larger than in the UK and Ireland. The drop in the UK and Ireland is greater than the rest of Western Europe, but not significantly so. The dotted line indicates the average decline for the four NANZ countries together (0.82 points). In Western Europe (excluding the UK and Ireland), the average drop was 0.30.
Even among the three pairs of English-speaking countries, there are very large differences in the extent of youth declines in wellbeing, so English-language social media content cannot be a sufficient explanation for the exceptionally large drops in North America. However, there is likely some role for language and culture to influence the effects of social media. For example, in French-speaking Quebec, the declines in youth wellbeing have been significantly less than the rest of Canada, which is mainly English-speaking.[56]
Evidence from Latin America
Data from Latin America provides the best opportunity to compare the links between life satisfaction and specific social media platforms. Just as the PISA data suggest that certain internet uses may be more or less harmful for wellbeing, the Latin American data sources allow us to examine whether certain social media platforms may be associated with better or worse wellbeing.
Latin America differs from the rest of the world, and especially from the NANZ region, by having high levels of engagement with social media, accompanied by high levels of wellbeing.
Two databases permit a deeper investigation into the relationship between happiness and social media use in Latin America with data covering respondents aged 15 and up. The first is the annual Latinobarómetro survey, covering 17 countries, which provides data on life satisfaction and, recently, the use of different social media platforms. The second is Mexico’s National Self-Reported Well-Being Survey (ENBIARE), which offers detailed wellbeing indicators – life satisfaction, the Cantril Ladder life evaluation, positive and negative affect, and mental health problems[57] – alongside frequency of use data for five social media platforms. These sources enable analysis within the distinct Latin American cultural, social, and economic context.
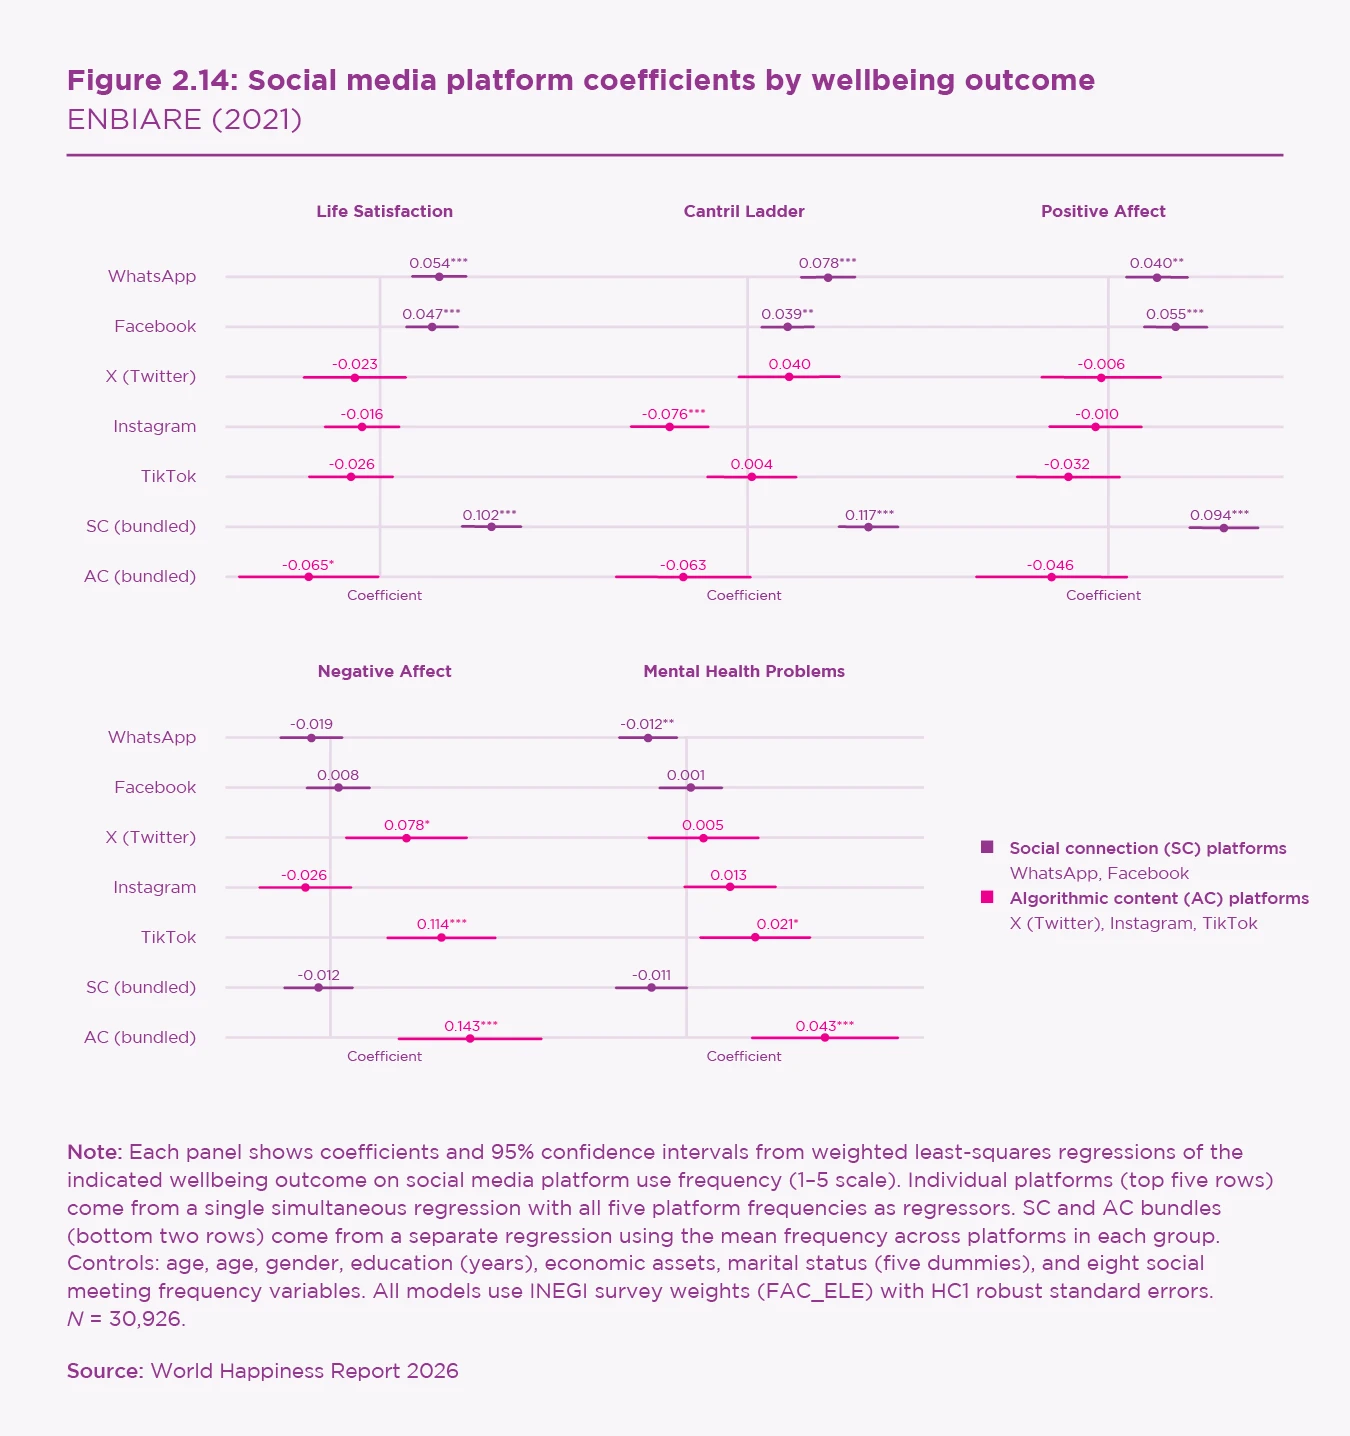
Data from the 2021 ENBIARE survey in Mexico reveal that WhatsApp and Facebook are the most prevalent platforms, used by 76% and 61% of the population, respectively. Platforms like X (Twitter), Instagram, and TikTok showed lower adoption rates (10%, 17%, and 11%, respectively).
Latin America differs from the rest of the world, and especially from the NANZ region, by having high levels of engagement with social media, accompanied by high levels of wellbeing.
Regression analyses controlling for socio-demographic and economic variables reveal a clear dichotomy, as shown in Figure 2.14. More frequent use of WhatsApp and Facebook is associated with higher life satisfaction, better life evaluation, and greater positive affect. WhatsApp use is further associated with lower negative affect and fewer mental health problems. In contrast, use of X (Twitter), Instagram, and TikTok is generally associated with lower happiness, and with significantly higher negative affect and mental health problems. Instagram use is also linked to lower life evaluations.
Thus, platforms can be categorised by their primary function and associated wellbeing outcomes. The social connection (SC) platforms – WhatsApp and Facebook – show favourable associations, while the algorithmic content (AC) platforms – X (Twitter), Instagram, and TikTok – show unfavourable ones, particularly for affective and mental health indicators. An analysis disaggregated by age and gender, focusing on SC versus AC platform use, shows consistent patterns across groups. SC platforms maintain a favourable association with all happiness indicators, whereas AC platforms show an unfavourable association.
In Figure 2.15, we expand the geographic coverage from Mexico to the 17 countries covered in the Latinobarómetro survey.
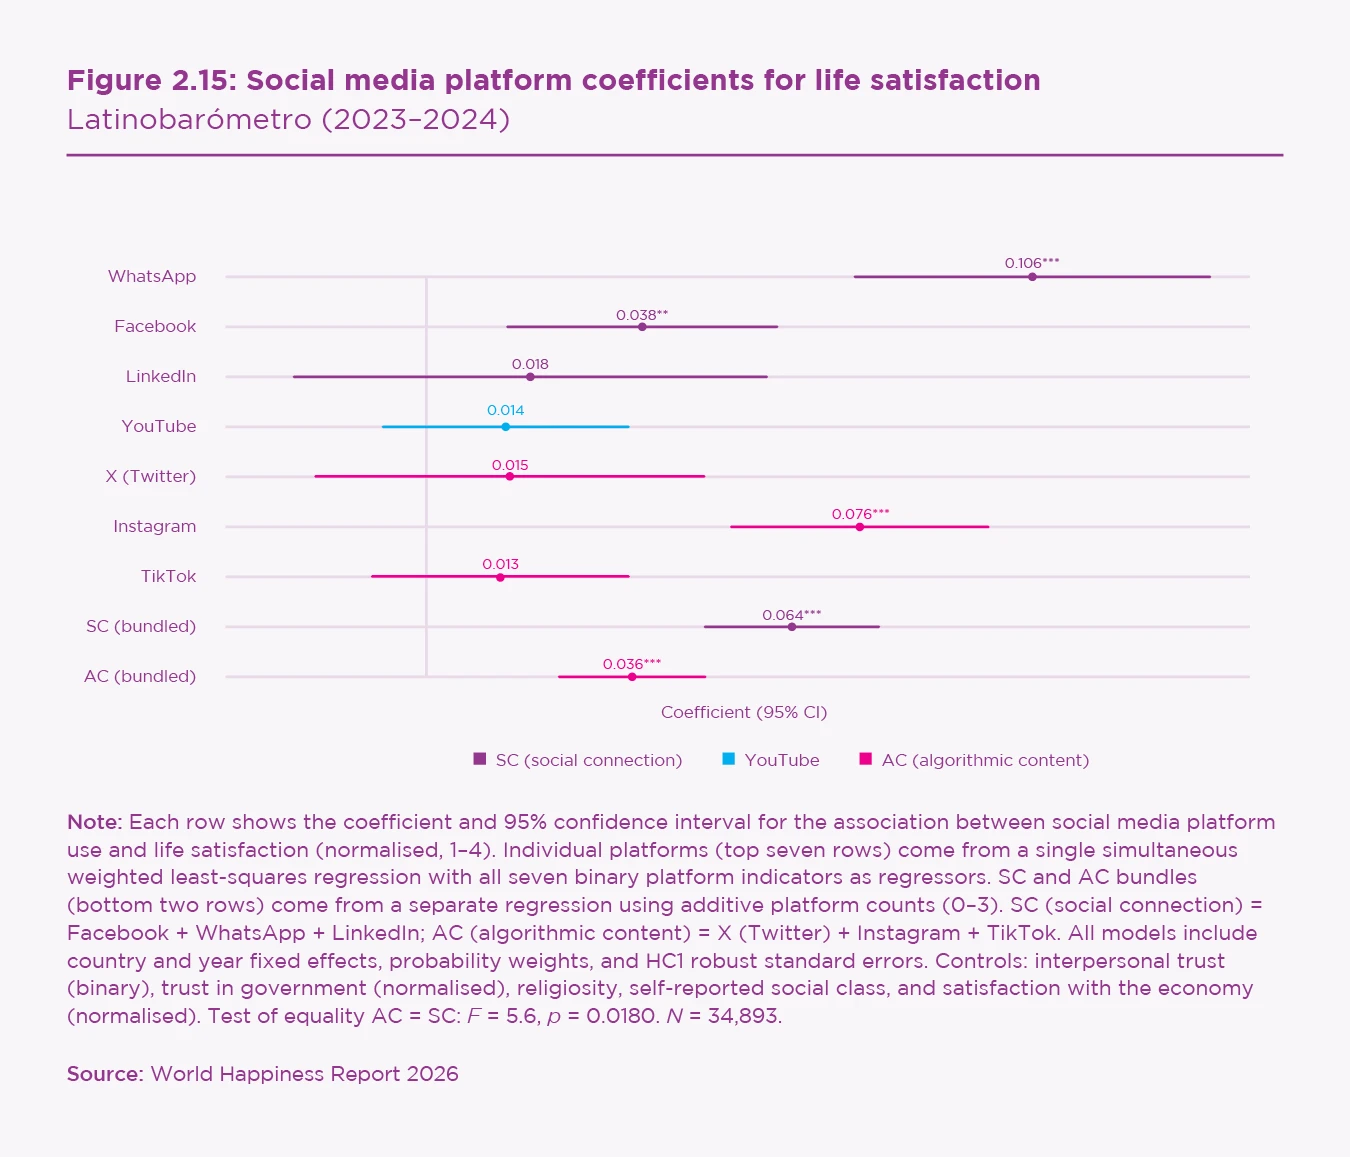
The coefficients for SC platforms are generally positive and significant, while those for AC platforms are generally less positive. The difference between the bundled SC and AC platforms shows the difference to be .045 (p < .0001). Disaggregation by age and gender shows the gap between the SC and AC coefficients to be about the same size for all four subgroups. Split by gender alone, the gap is slightly larger for males than females.[58] Split by age alone, the gap is slightly larger for the young, with the AC coefficient effectively zero for them.[59] For young men and young women considered separately, the SC-AC differences are slightly larger than for the whole sample, and slightly larger for males than females.[60]
In Figure 2.16, we show the correlations for the SC and AC platforms in all 17 countries. The positive correlations between life satisfaction and platform type are generally higher for SC platforms than for AC ones.
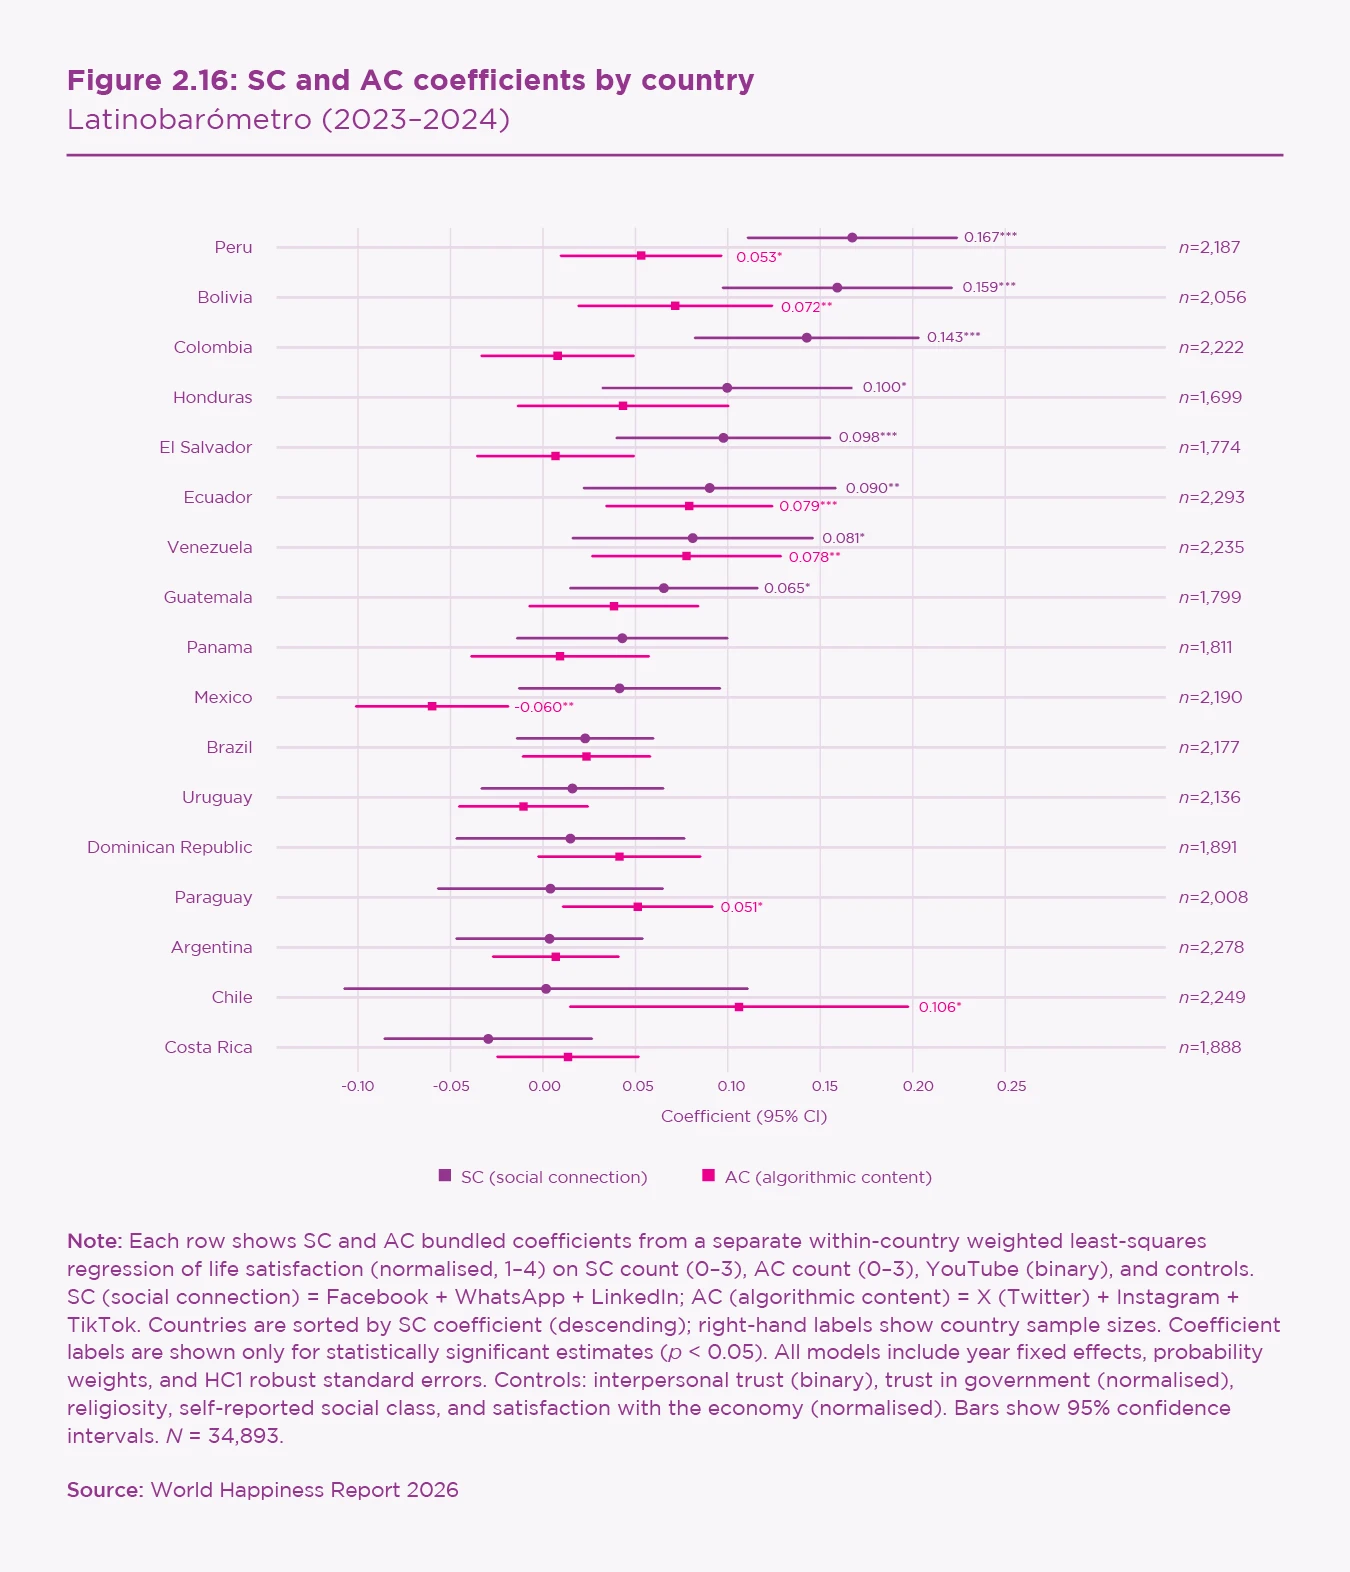
The country-level analyses yield only one insignificantly negative SC coefficient, and the SC coefficients are above the AC coefficients in 11 of 17 countries. Six of the AC coefficients are significantly positive, and one is significantly negative. The relationship holds in most Latin American countries. Notably, while SC significantly exceeds AC in five countries, AC does not significantly exceed SC in any of the 17 countries. The pooled SC-AC difference is significantly positive.[61]
To compare the five wellbeing outcomes from the ENBIARE data with each other, and with the Latinobarómetro life satisfaction results, we redid the analysis in standardised units to accommodate the differing scales and distributions. We find that all five of the ENBIARE outcomes and the Latinobarómetro analysis, for all 17 countries and for Mexico alone, all give strong and consistent evidence about the differences between the two types of platform. The SC-AC gap is in the .06 to .10 range for all standardised outcomes. Given the differences in the questions asked (number of platforms used in the Latinobarómetro and intensity of use in ENBIARE), the differences in outcomes measured (ranging from life satisfaction to the incidence of mental health problems), and the different scales being used for measuring outcomes, the strength and consistency of the results is remarkable. Social media platform type does matter, and importantly so.
In conclusion, the Latin American evidence indicates a generally positive association between social media use and happiness, with linkages differing strongly by platform type. The positive associations are strong for widely used platforms that facilitate social connection. By contrast, platforms based on algorithmic content show less favourable relationships. These findings demonstrate that the relationship between social media and happiness is contingent upon both platform design and the broader cultural and social context in which social media use takes place. These findings, along with the evidence summarised in the next section, suggest that SC platforms may contribute significantly to happiness in societies where dense and deep social connections already exist.
Putting the evidence in context
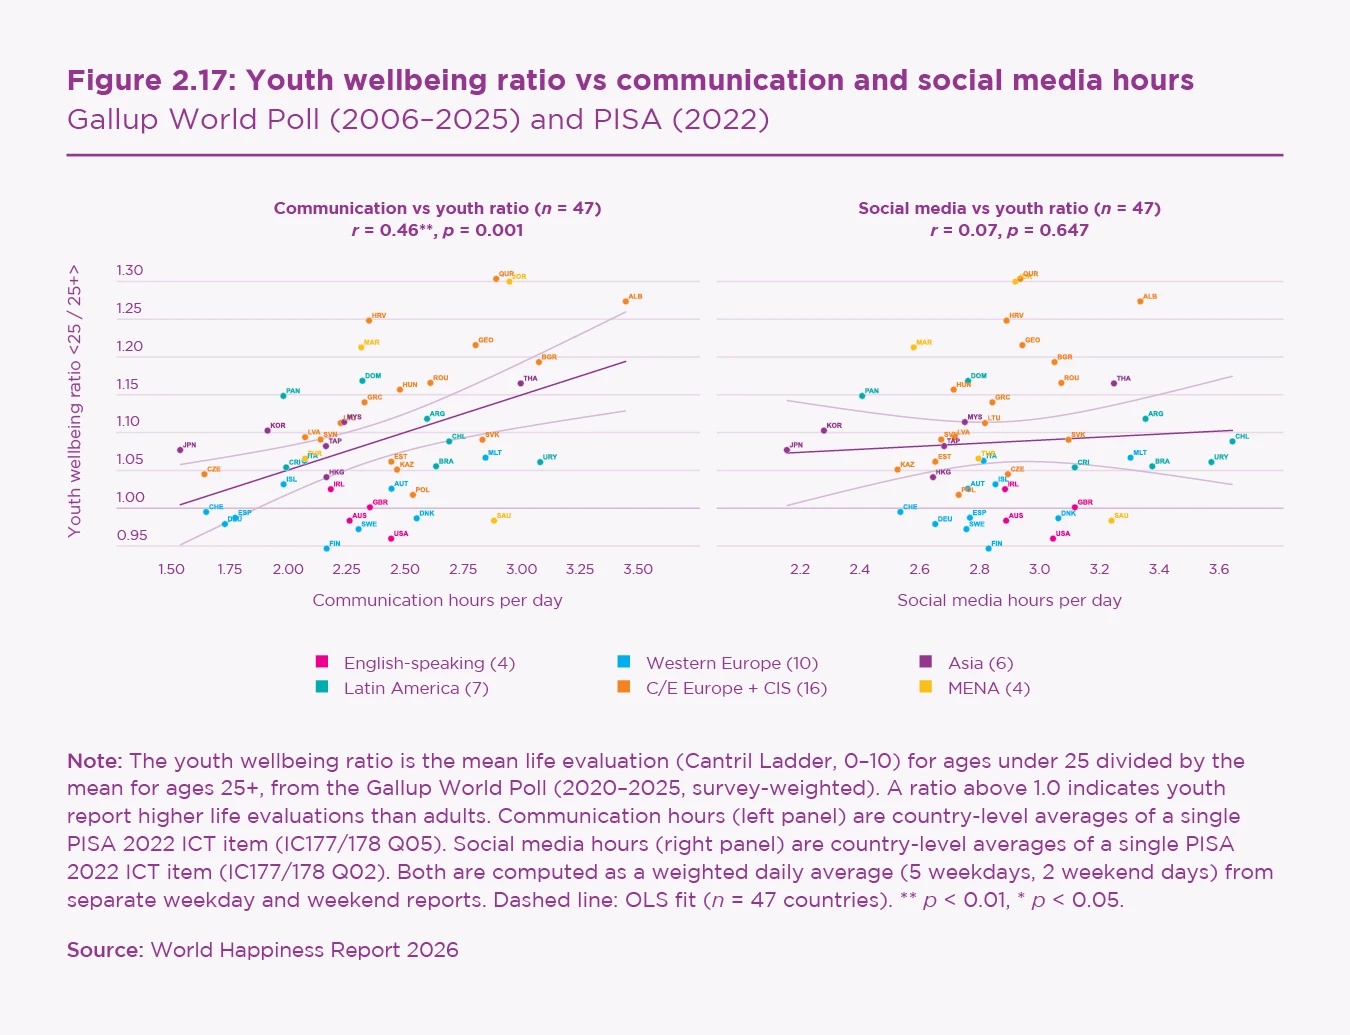
In Figure 2.17, we plot national averages for two internet activities (communication and social media) against a youth wellbeing ratio (the mean Gallup World Poll life evaluation for under-25s divided by the mean for ages 25 and above). This reveals a significant positive cross-country relationship between communication hours and life satisfaction (r = 0.46, p = .001), with the English-speaking countries having much lower youth wellbeing than predicted. By contrast, there is no significant relationship between social media use and the relative happiness of the young. Here, too, the English-speaking countries lie at the bottom of the youth wellbeing ratio while being in the middle for social media use. The Latin American countries are at the higher end of social media use, while having average levels of relative youth happiness.
In several earlier figures, we showed how life satisfaction correlates with time spent on seven different internet activities. In Figure 2.18, we show how academic scores (the original purpose of PISA), feelings of belonging in the school community, and school attendance vary by reported social media use. We also assess how all these features of school life vary for those who do not use social media. We first consider those who do not use the internet at all (2.3% of girls and 3.2% of boys), and then split the rest of non-users between those who use neither social media nor communications activities (1.9% or girls and 3.3% of boys), and those who do make communications uses of the internet but do not use social media (1.7% of girls and 2.6% of boys).
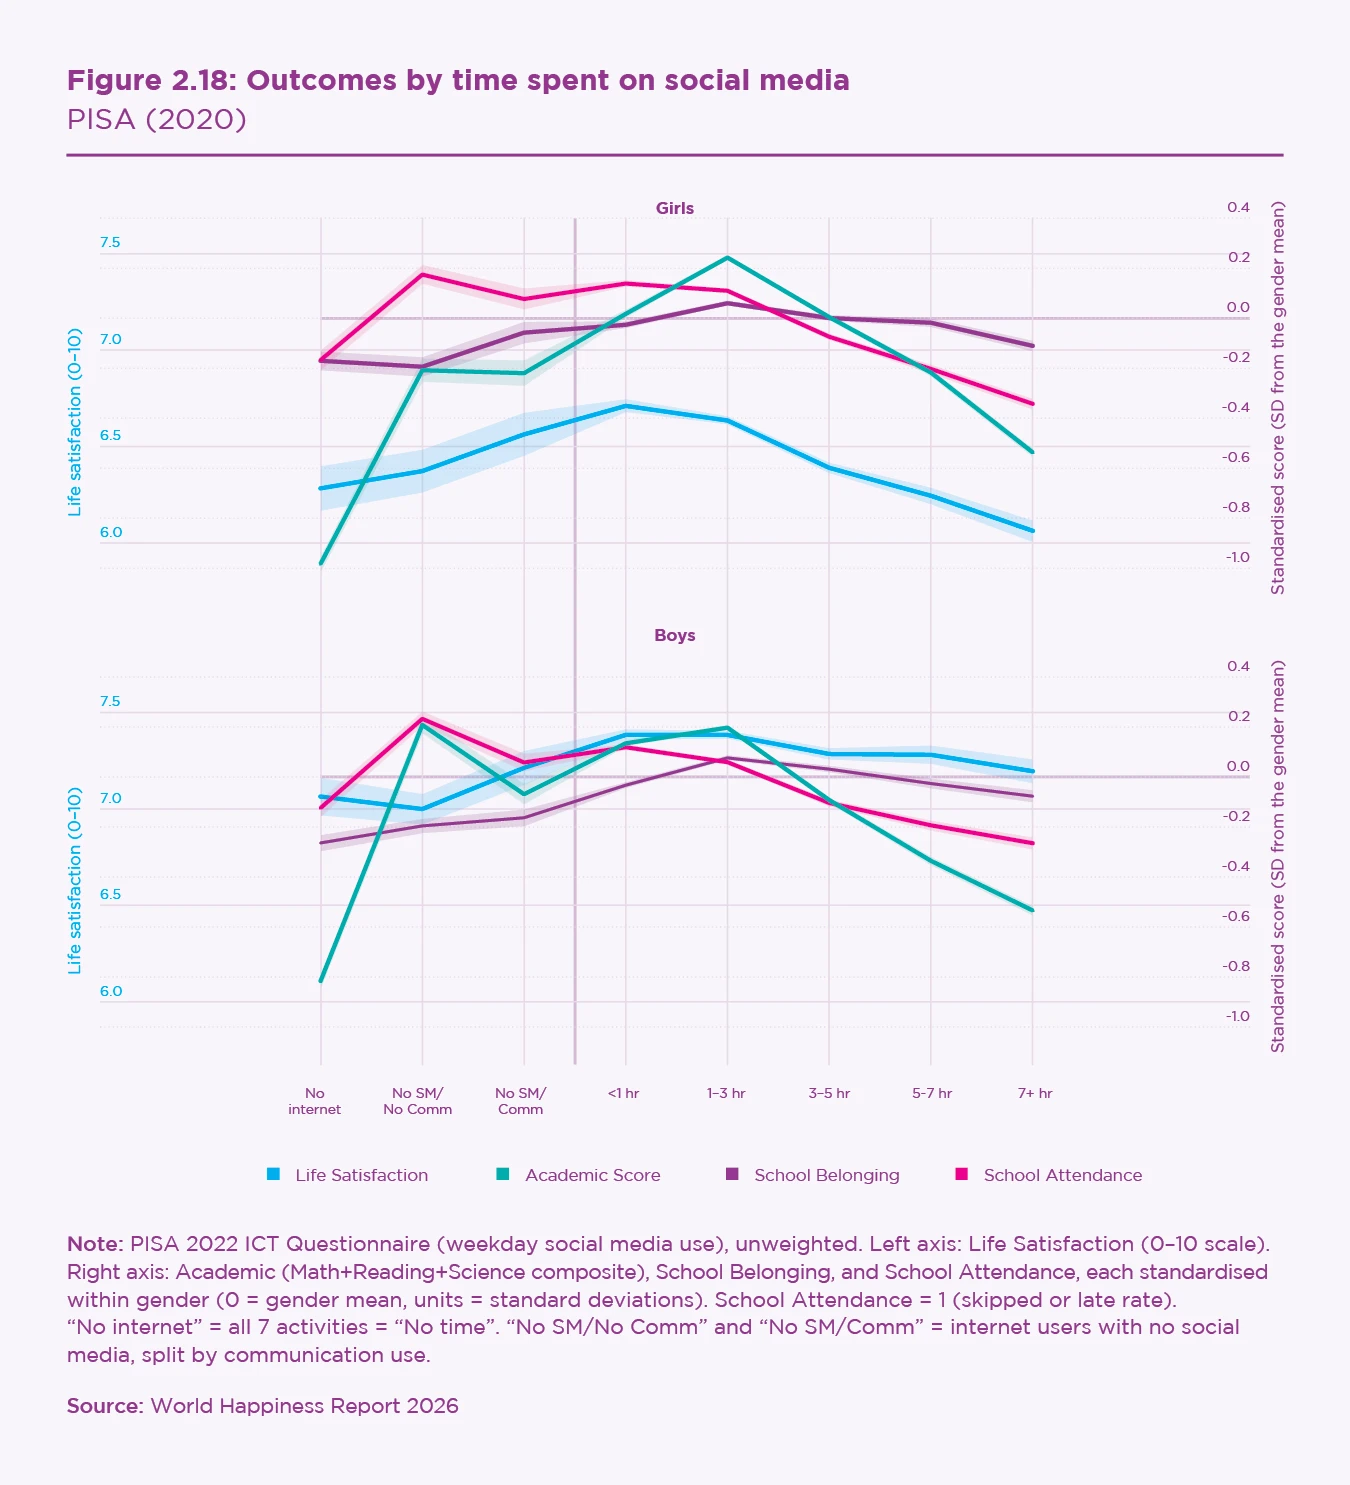
For girls, average life satisfaction rises continually from no internet[62] to internet use with neither social media nor communications, and to those with the lowest levels of social media use (<1 hour). Above that <1 hour category, the average life satisfaction of girls is steadily lower at higher rates of social media use. Boys show a different pattern, with increases from no communications activity to a high point in the 0 to 3 hour range, and only slight reductions thereafter.
For both girls and boys, academic scores tend to be lowest for those with no internet use, highest at moderate levels of use, and sharply lower at high levels of social media use. School attendance is highest with internet access but no social media or communications uses and is substantially lower at higher rates of social media use. For feelings of school belonging, the curve is flatter, with the highest levels of school belonging at moderate social media use.
Even for those most at risk of harm from social media (girls in English-speaking countries), the life satisfaction gains associated with moving from the 10th to the 90th percentile in school belonging are four times larger than those of moving from the 90th to the 10th percentile of social media use.
Perhaps the most important finding from this expanded view of life at school is not apparent in the figure, but appears when we see how these four aspects of life – school belonging, social media use, academic scores, and school attendance – differ in their links to life satisfaction, as shown in Table 2.4.
| Girls | ||||||
|---|---|---|---|---|---|---|
| Region | n | Belonging | Attendance | Academic | SM hours | Bel/SM |
| Western Europe | 35,717 | +0.361*** | +0.162*** | +0.043*** | -0.098*** | 3.7x |
| English-speaking | 6,995 | +0.431*** | +0.204*** | +0.048*** | -0.142*** | 3.0x |
| Central and Eastern Europe | 44,533 | +0.340*** | +0.117*** | -0.052*** | -0.088*** | 3.9x |
| Latin America | 14,408 | +0.275*** | +0.108*** | 0.003 | -0.060*** | 4.6x |
| Middle East and North Africa | 10,043 | +0.269*** | +0.105*** | +0.025* | -0.049*** | 5.5x |
| Asia | 22,292 | +0.340*** | +0.090*** | +0.033*** | -0.056*** | 6.1x |
| 47 Countries | 133,988 | +0.339*** | +0.129*** | 0.005 | -0.084*** | 4.1x |
| Boys | ||||||
| Region | n | Belonging | Attendance | Academic | SM hours | Bel/SM |
| Western Europe | 35,145 | +0.291*** | +0.106*** | -0.008 | -0.043*** | 6.7x |
| English-speaking | 6,865 | +0.381*** | +0.126*** | -0.032** | -0.055*** | 7.0x |
| Central and Eastern Europe | 43,374 | +0.254*** | +0.071*** | -0.097*** | -0.014** | 18.2x |
| Latin America | 14,163 | +0.228*** | +0.079*** | -0.058*** | 0.004 | 60.6x |
| Middle East and North Africa | 8,392 | +0.168*** | +0.069*** | 0.002 | 0.007 | 24.2x |
| Asia | 21,757 | +0.296*** | +0.054*** | -0.014* | 0.003 | 119.5x |
| 47 Countries | 129,696 | +0.271*** | +0.081*** | -0.044*** | -0.019*** | 14.3x |
Note: 47 countries. All variables z-scored within each country before pooling. Excludes students with no internet use. *** p < 0.001, ** p < 0.01, * p < 0.05. Bel/SM = ratio of |Belonging| to |SM Hours| correlation with life satisfaction.
For both boys and girls, in all regions, feeling a sense of belonging is the most important of the four variables by far. Even for those most at risk of harm from social media (girls in English-speaking countries), the life satisfaction gains associated with moving from the 10th to the 90th percentile in school belonging are four times larger than those of moving from the 90th to the 10th percentile of social media use. In the 47-country global sample, the belonging effect is six times larger.
The PISA evidence covers many countries and assesses students at an important stage of life and learning. The evidence is correlational, and in both cases is likely to overstate the direct causal effects, since both are likely to be reinforced by feedback loops. Unhappy students are likely to be drawn deeper into the vortex of social media excess, which in turn leads to more unhappiness. Happy students are more likely to feel, report, and contribute to high levels of belonging to the school community, which will tend, in turn, to lead to greater happiness for them and their school communities.
Although the correlations may overstate the one-way causal effects, the relative importance of belonging and social media seems well-established. The chapters in the rest of this report are devoted to measuring and reversing the downward spiral of social media overuse, while the World Happiness Report has, over many years, studied the positive feedback between belonging, social connection, trust, and happiness.

Summary
In the first part of our analysis, we revealed the basic puzzle to be explained: a large fall in youth wellbeing in the NANZ group of four mainly English-speaking countries, with later evidence suggesting a partially echoing drop in the UK and Ireland, the two English-speaking countries of Western Europe. Our task was to see if these patterns might be explained by international differences in social media prevalence and content.
First, we used individual data for cellphone access to the internet (for 2017–2025) and any use of social media in the previous 30 days (for 2022 only) to see if they correlated with individual life evaluations, after controlling for the six variables we use to explain differences in life evaluations. Cellphone access to the internet had a positive partial correlation with individual life evaluations in every global region, except in NANZ, where the coefficient was negative and large. When the UK and Ireland were split from the other countries in Western Europe, they also showed a significant negative relation, about one-third as large as the NANZ countries. The estimates for the coefficients on any social media use in the previous 30 days (well over 90%) were much less precise, but remarkably similar in magnitude to those for cellphone access to the internet (r = 0.93). These results suggested that social media and internet access were beneficial in most areas of the world, outside the NANZ group.
This evidence, although suggestive, did not measure the intensity or structure of social media use, did not separate social media use from other uses of the internet, or assess differences among social media platforms. Fortunately, we were able to harness other sources of internationally comparable data that allowed us to address these important questions.
First, we used data from 47 countries in the 2022 PISA survey, which contained a special block of questions about the daily use of seven different types of internet activity, one of which was social media. Unfortunately, the four NANZ countries are not among the 47, since none of them collected life satisfaction data in the 2022 survey. Social media and other internet use data were collected for the United States and Australia, permitting them to be included in our internet use analysis even though they are excluded from the life satisfaction analysis.
For all global regions, excluding non-users of the internet, we found that some limited use (<1 hour per day) was associated with higher life satisfaction than no use for each of the seven activities. Higher rates of use were generally associated with lower life satisfaction, especially for social media, gaming, and browsing for fun, and more for girls than for boys. The other four uses (communication, news, learning, and content creation) showed smaller drops in average life satisfaction at higher rates of use, being essentially flat for boys.
The amount and structure of internet use by the PISA students were remarkably similar in all global regions covered. As a result, we concluded that differences in youth happiness among regions could not be explained by the number of hours devoted to social media. Figure 2.17 showed essentially no connection between national average hours of social media use and youth happiness. For six of the regions, there are substantial differences in youth happiness, but none in average hours of social media use. The two exceptions to this are the NANZ countries (represented in the social media use data by the United States and Australia), with by far the lowest relative youth wellbeing, and Latin America, with the highest average hours of social media use and quite high levels of relative youth wellbeing.
Higher rates of use were generally associated with lower life satisfaction, especially for social media, gaming, and browsing for fun, and more for girls than for boys.
Thus, for social media to play a major role in explaining the different levels of youth wellbeing around the world, their influence must depend on how they are used. If the content of social media depends on differences in culture and language, then the drops in youth wellbeing found in the NANZ countries should also be seen in the UK and Ireland, the two English-speaking countries of Western Europe. We found that the decline in youth wellbeing was much less in the UK and Ireland than in any of the NANZ countries, although it was slightly greater than the rest of Western Europe, but not significantly so (see Figure 2.13).[63]
The Latin American surveys further enriched our analysis by assessing the wellbeing links with specific social media platforms. We found significant differences between two platform types. Those emphasising social connections (SC) were more positively associated with life satisfaction than those with algorithmic content (AC). The Mexican data also had intensity of use, with positive linkages decreasing at higher use rates, and becoming negative for some of the AC platforms.
The generally positive relationships between social media use (at least at moderate levels) in both Latin American surveys provide some confirmation of the Table 2.4 evidence showing that Latin American students are apparently able to use social media in more positive ways than elsewhere.
Finally, we used the PISA data to take a broader view of the lives of 15-year-olds in 47 countries by adding school attendance, academic performance, and school belonging. We now had four outcomes, three of which showed evidence of the Goldilocks hypothesis, whereby the best outcomes were at moderate rates of social media use.[64] School attendance was different, as it was highest for those students who had internet access but did not use any social media. Life satisfaction was highest among those with modest levels of social media. The turning points for both academic performance and school belonging were at higher rates of social media use, but not by much. To get some idea of the relative strength of the life satisfaction correlations with social media use and having a high sense of school belonging, we calculated within-country standardised correlations. These were several times larger for school belonging than for social media use.
Social media platforms that emphasise communication are better at supporting happiness than those with algorithmic content.
Averting negative consequences of bad design and misuse of social media, and supporting the positive spiral of trust, belonging, and happiness are both important. They are also likely to be linked. How are efforts to control social media use likely to affect the sense of school belonging, and how are efforts to build school belonging likely to affect the misuse of social media?
Getting the right answers to those questions is now more important than ever, as social media and social connections continue to change at what seem like ever faster rates. Platform design matters. As our Latin American evidence shows, social media platforms that emphasise communication are better at supporting happiness than those with algorithmic content. The extent and nature of such linkages deserve broad and timely tracking as social media, artificial intelligence, and their users respond to changes in technology, social norms, and regulatory frameworks.
References
American Psychological Association. (2023). Health advisory on social media use in adolescence. https://www.apa.org/topics/social-media-internet/health-advisory-adolescent-social-media-use
Annas, J. (1993). The morality of happiness. Oxford University Press.
Baumeister, R. F., Bratslavsky, E., Finkenauer, C., & Vohs, K. D. (2001). Bad is stronger than good. Review of General Psychology, 5(4), 323-370. https://doi.org/10.1037/1089-2680.5.4.323
Bloem, J. R., & Oswald, A. J. (2022). The analysis of human feelings: a practical suggestion for a robustness test. Review of Income and Wealth, 68(3), 689-710. https://doi.org/10.1111/roiw.12531
Bond, T. N., & Lang, K. (2019). The sad truth about happiness scales. Journal of Political Economy, 127(4), 1629–1640. https://doi.org/10.1086/701679
Boniel-Nissim, M., van den Eijnden, R. J. J. M., Furstova, J., Marino, C., Lahti, H., Inchley, J., Šmigelskas, K., Vieno, A., & Badura, P. (2022). International perspectives on social media use among adolescents: Implications for mental and social well-being and substance use. Computers in Human Behavior, 129, 107144. https://doi.org/10.1016/j.chb.2021.107144
Brannigan, R., Cronin, F., McEvoy, O., Stanistreet, D., & Layte, R. (2022). Verification of the Goldilocks Hypothesis: the association between screen use, digital media and psychiatric symptoms in the Growing Up in Ireland study. Social Psychiatry and Psychiatric Epidemiology, 58(8), 1259-1264. https://doi.org/10.1007/s00127-022-02352-5
Büchi, M., & Hargittai, E. (2022). A need for considering digital inequality when studying social media use and well-being. Social Media and Society, 8(1). https://doi.org/10.1177/20563051211069125
Chen, C., Lee, S. Y., & Stevenson, H. W. (1995). Response style and cross-cultural comparisons of rating scales among East Asian and North American students. Psychological Science, 6(3), 170–175. https://doi.org/10.1111/j.1467-9280.1995.tb00327.x
Chida, Y., & Steptoe, A. (2008). Positive psychological well-being and mortality: A quantitative review of prospective observational studies. Psychosomatic Medicine, 70(7), 741-756. https://doi.org/10.1097/PSY.0b013e31818105ba
Cohen, S., Doyle, W. J., Turner, R. B., Alper, C. M., & Skoner, D. P. (2003). Emotional style and susceptibility to the common cold. Psychosomatic Medicine, 65(4), 652-657. https://doi.org/10.1097/01.PSY.0000077508.57784.DA
Coyne, S. M., Rogers, A. A., Zurcher, J. D., Stockdale, L., & Booth, M. (2020). Does time spent using social media impact mental health?: An eight year longitudinal study. Computers in Human Behavior, 104, 106160. https://doi.org/10.1016/j.chb.2019.106160
Danner, D. D., Snowdon, D. A., & Friesen, W. V. (2001). Positive emotions in early life and longevity: Findings from the nun study. Journal of Personality and Social Psychology, 80(5), 804–813. https://doi.org/10.1037/0022-3514.80.5.804
De Neve, J. E., Diener, E., Tay, L., & Xuereb, C. (2013). The objective benefits of subjective well-being. In J. F. Helliwell, R. Layard, & J. Sachs (Eds.), World Happiness Report 2013 (pp. 54–79). New York: SDSN.
Doyle, W. J., Gentile, D. A., & Cohen, S. (2006). Emotional style, nasal cytokines, and illness expression after experimental rhinovirus exposure. Brain, behavior, and immunity, 20(2), 175-181. https://doi.org/10.1016/j.bbi.2005.05.005
Ferrer‐i‐Carbonell, A., & Frijters, P. (2004). How important is methodology for the estimates of the determinants of happiness?. The Economic Journal, 114(497), 641–659. https://doi.org/10.1111/j.1468-0297.2004.00235.x
Fortin, N., Helliwell, J.F., Wang, S. (2015) How does subjective well-being vary around the world by gender and age? In J. F. Helliwell, R. Layard, & J. Sachs (Eds.), World Happiness Report 2015 (pp. 42–74). New York: SDSN.
Fredrickson, B. L. (2001). The role of positive emotions in positive psychology: The broaden-and-build theory of positive emotions. American Psychologist, 56(3), 218–226. https://doi.org/10.1037/0003-066X.56.3.218
Gaia, A., Sala, E., & Cerati, G. (2021). Social networking sites use and life satisfaction. A quantitative study on older people living in Europe. European Societies, 23(1), 98–118. https://doi.org/10.1080/14616696.2020.1762910
Galea, S., & Buckley, G. J. (2024). Social media and adolescent mental health: A consensus report of the National Academies of Sciences, Engineering, and Medicine. PNAS Nexus, 3, 1-3. https://doi.org/10.1093/pnasnexus/pgae037
Gestsdottir, S., Arnarsson, A., Magnusson, K., Arngrimsson, S. A., Sveinsson, T., & Johannsson, E. (2015). Gender differences in development of mental well-being from adolescence to young adulthood: An eight-year follow-up study. Scandinavian Journal of Public Health, 43(3), 269-275. https://doi.org/10.1177/1403494815569864
Grice, H. P. (1975). Logic and conversation. In Cole P., Morgan J. (Eds.), Syntax and semantics 3: Speech acts (Vol. 3, pp. 41–58). Academic Press.
Hargittai, E., & Hinnant, A. (2008). Digital inequality: Differences in young adults’ use of the Internet. Communication Research, 35(5), 602-621. https://doi.org/10.1177/0093650208321782
Helliwell, J. F., & Aknin, L. B. (2018). Expanding the social science of happiness. Nature Human Behaviour, 2(4), 248-252. https://doi.org/10.1038/s41562-018-0308-5
Helliwell, J. F., Shiplett, H., & Bonikowska, A. (2020). Migration as a test of the happiness set‐point hypothesis: Evidence from immigration to Canada and the United Kingdom. Canadian Journal of Economics/Revue canadienne d’économique, 53(4), 1618-1641. https://doi.org/10.1111/caje.12474
Helliwell, J. F., & Wang, S. (2014). Weekends and subjective well-being. Social indicators Research, 116(2), 389-407. https://doi.org/10.1007/s11205-013-0306-y
Helliwell, J. F., Layard, R., Sachs, J. D., De Neve, J.-E., Aknin, L. B., & Wang, S. (2026). Why single-item measures of wellbeing are best. Nature Human Behaviour. https://doi.org/10.1038/s41562-026-02401-y
Henkens, J. H., Kalmijn, M., & de Valk, H. A. (2022). Life satisfaction development in the transition to adulthood: Differences by gender and immigrant background. Journal of Youth and Adolescence, 51(2), 305-319. https://doi.org/10.1007/s10964-021-01560-7
Huang, H., Helliwell, J., & Norton, M. (2025). The happiness crisis for younger generations in Canada and the United States: What is different and what is not (University of Alberta Department of Economics working paper No. 2025-05). https://ideas.repec.org/p/ris/albaec/2025_005.html
Jarman, H. K., McLean, S. A., Paxton, S. J., Sibley, C. G., & Marques, M. D. (2023). Examination of the temporal sequence between social media use and well-being in a representative sample of adults. Social Psychiatry and Psychiatric Epidemiology, 58(8), 1247–1258. https://doi.org/10.1007/s00127-022-02363-2
Kaiser, C., & Oswald, A. J. (2022). The scientific value of numerical measures of human feelings. Proceedings of the National Academy of Sciences, 119(42), e2210412119. https://doi.org/10.1073/pnas.2210412119
Kapteyn, A., Perez-Arce, F., Sandlin, E. W., & Stone, A. A. (2025). Life satisfaction responds to major life events; Affect not so much. Social Indicators Research, 180, 1747–1763. https://doi.org/10.1007/s11205-025-03724-5
Keles, B., McCrae, N., & Grealish, A. (2020). A systematic review: The influence of social media on depression, anxiety and psychological distress in adolescents. International Journal of Adolescence and Youth, 25(1), 79–93. https://doi.org/10.1080/02673843.2019.1590851
Krueger, A. B., & Schkade, D. A. (2008). The reliability of subjective well-being measures. Journal of Public Economics, 92(8-9), 1833–1845. https://doi.org/10.1016/j.jpubeco.2007.12.015
Marquez, J., Taylor, L., Boyle, L., Zhou, W., & De Neve, J.-E.(2024). Child and Adolescent Well-Being: Global Trends, Challenges and Opportunities. World Happiness Report. University of Oxford. https://doi.org/10.18724/WHR-91B0-EK06
Martingano, A. J., Konrath, S., Zarins, S., & Okaomee, A. A. (2022). Empathy, narcissism, alexithymia, and social media use. Psychology of Popular Media, 11(4), 413–422. https://doi.org/10.1037/ppm0000419
Mogstad, M., Romano J.P., Shaikh, A. & Wilhelm D. (2024). Inference for ranks with applications to mobility across neighbourhoods and academic achievement across countries. The Review of Economic Studies, 91(1), 476–518. https://doi.org/10.1093/restud/rdad006
Nennstiel, R., & Ullrich, R. (2026). The Goldilocks dilemma: Gendered patterns of social media usage and adolescent life satisfaction across OECD countries. Large-scale Assessments in Education, 14(1), 11. https://doi.org/10.1186/s40536-026-00284-z
Nilsson, A. H., Eichstaedt, J. C., Lomas, T., Schwartz, A., & Kjell, O. (2024). The Cantril Ladder elicits thoughts about power and wealth. Scientific Reports, 14(1), 2642. https://doi.org/10.1038/s41598-024-52939-y
Orben, A., Dienlin, T., & Przybylski, A. K. (2019). Social media’s enduring effect on adolescent life satisfaction. Proceedings of the National Academy of Sciences, 116(21), 10226–10228. https://doi.org/10.1073/pnas.1902058116
Orben, A., Lucas, R. E., Fuhrmann, D., & Kievit, R. A. (2022). Trajectories of adolescent life satisfaction. Royal Society Open Science, 9(8). https://doi.org/10.1098/rsos.211808
OECD, (2025a). How do people experience new technologies and generative AI?: Insights from a few countries worldwide. OECD Policy Insights on Well-being, Inclusion and Equal Opportunity, No. 23. https://doi.org/10.1787/49b8d10e-en
OECD, (2025b). How’s Life for Children in the Digital Age? OECD Publishing, Paris, https://doi.org/10.1787/0854b900-en
OECD, (2025c). Screen time and subjective well-being: Insights from a few countries worldwide. OECD Policy Insights on Well-being, Inclusion and Equal Opportunity, No. 24. https://doi.org/10.1787/c840403c-en
Pressman, S. D., Jenkins, B. N., & Moskowitz, J. T. (2019). Positive affect and health: What do we know and where next should we go?. Annual Review of Psychology, 70, 627-650. https://doi.org/10.1146/annurev-psych-010418-102955
Przybylski, A. K., & Weinstein, N. (2017). A large-scale test of the Goldilocks Hypothesis: Quantifying the relations between digital-screen use and the mental well-being of adolescents. Psychological Science, 28(2), 204–215. https://doi.org/10.1177/0956797616678438
Rojas, M. (2018). Happiness in Latin America has social foundations. In J. F. Helliwell, R. Layard, & J. Sachs (Eds.), World Happiness Report 2018 (pp. 114–145). New York: SDSN.
Shakya, H. B., & Christakis, N. A. (2017). Association of Facebook Use With Compromised Well-Being: A Longitudinal Study. American Journal of Epidemiology, 185(3), 203–211. https://doi.org/10.1093/aje/kww189
Singh, B., Zhou, M., Curtis, R., Maher, C., & Dumuid, D. (2026). Social media use and well-being across adolescent development. JAMA Pediatrics. https://doi.org/10.1001/jamapediatrics.2025.5619
Soroka, S. N. (2006). Good news and bad news: Asymmetric responses to economic information. The Journal of Politics, 68(2), 372-385. https://doi.org/10.1111/j.1468-2508.2006.00413.x
Thorisdottir, I. E., Sigurvinsdottir, R., Asgeirsdottir, B. B., Allegrante, J. P., & Sigfusdottir, I. D. (2019). Active and Passive Social Media Use and Symptoms of Anxiety and Depressed Mood Among Icelandic Adolescents. Cyberpsychology, Behavior, and Social Networking, 22(8), 535–542. https://doi.org/10.1089/cyber.2019.0079
Twenge, J. M. (2019). The sad state of happiness in the United States and the role of digital media. In J. Helliwell, R. Layard, & J. D. Sachs (Eds.), World Happiness Report 2019 (pp. 87–96). New York: SDSN.
Twenge, J. M., Haidt, J., Lozano, J., & Cummins, K. M. (2022). Specification curve analysis shows that social media use is linked to poor mental health, especially among girls. Acta Psychologica, 224, 103512. https://doi.org/10.1016/j.actpsy.2022.103512
VanderWeele, T.J., & Johnson, B.R. (2025) Multidimensional versus unidimensional approaches to well-being. Nature Human Behavior, 9, 857–863. https://doi.org/10.1038/s41562-025-02187-5
VanderWeele, T.J., Johnson, B.R., Bialowolski, P.T. et al. (2025) The Global Flourishing Study: Study Profile and Initial Results on Flourishing. Nature Mental Health, 3, 636–653*.* https://doi.org/10.1038/s44220-025-00423-5
Vannucci, A., Flannery, K. M., & Ohannessian, C. M. (2017). Social media use and anxiety in emerging adults. Journal of Affective Disorders, 207, 163–166. https://doi.org/10.1016/j.jad.2016.08.040
Vuorre, M., & Przybylski, A. K. (2023). Estimating the association between Facebook adoption and well-being in 72 countries. Royal Society Open Science, 10(8), 221451. https://doi.org/10.1098/rsos.221451
Endnotes
Figure 19 in the online statistical appendix to this chapter shows changes of life evaluations of those under 25 years of age from 2006–2010 to 2023–2025. In that list of 136 countries, all four of the NANZ countries rank very low, with drops of 0.623 in Australia, 0.718 in New Zealand, 0.960 in the United States, and 1.138 in Canada. Several other Western industrial countries had drops in youth happiness of 0.4 points or more, putting them among the bottom 25 in the list of changes in youth happiness: Ireland at 0.461, Belgium at 0.576, the United Kingdom at 0.591, France at 0.599, Norway at 0.670, and Switzerland at 0.813. ↩︎
For instance see Nilsson et al. (2024), VanderWeele and Johnson (2025), VanderWeele et al. (2025). ↩︎
See Annas (1993) for the Aristotelian view of happiness, and our previous writing on why “happiness” is an appropriate label for this scientific field of study (Helliwell & Aknin, 2018). ↩︎
See Helliwell and Wang (2014) on weekend effects appearing only for emotions, and Kapteyn et al. (2025) for major life events having greater impacts on life evaluations than on emotions. See also the position in linguistic philosophy (Grice, 1975) that meaning is provided by the conversational context, in just the way we observe from the differing answers to ‘happy yesterday’ and ‘happy about life as a whole’. ↩︎
See Baumeister et al. (2001) for a comprehensive review of the prevalence of the negativity bias. Soroka (2006) presents UK evidence that this negativity bias is amplified by the media, so that “Mass media respond asymmetrically to economic information, and the public then responds asymmetrically to both media content and the economy itself.” ↩︎
A country’s average answer to the Cantril Ladder question is exactly equivalent to a notion of average underlying satisfaction with life under an assumption of cardinality: the idea that the difference between a 4 and a 3 should count the same as the difference between a 3 and a 2, and be comparable across individuals. Some social scientists argue that too little is known about how people choose their answer to the Cantril Ladder question to make this assumption and that if it is wrong enough, then rankings based on average survey responses could differ from rankings based on underlying satisfaction with life (Bond & Lang, 2019). Other researchers have concluded that answers to the Cantril Ladder question are indeed approximately cardinal (Bloem & Oswald, 2022; Ferrer-i-Carbonell & Frijters, 2004; Kaiser & Oswald, 2022; Krueger & Schkade, 2008). ↩︎
For any pair of countries, the confidence intervals for the means (depicted in Figure 2.1 as whiskers) can be used to gauge which country’s mean is higher than the other, accounting for statistical uncertainty in the measurement of each. The confidence interval for a country’s rank (given in Figure 2.1 as text, in the form (x–y) represents a range of possible values for the ranking of their mean among all countries, accounting for uncertainty in the measurement of all of the means (following Mogstad et al. 2024). The ranges are constructed so that the chance that the range does not contain the country’s true rank is no more than 5%. ↩︎
Not every country has a survey every year. The total sample sizes are reported in the online statistical appendix and are reflected in Figure 2.1 by the size of the 95% confidence intervals for the mean, indicated by horizontal lines. The confidence intervals are naturally tighter for countries with larger samples. ↩︎
See Helliwell et al. (2020) for a detailed analysis of the life satisfaction of immigrants to the United Kingdom and Canada from many source countries. ↩︎
The East-West convergence has been happening within Germany itself. In 2008–2010, life evaluations were almost half a point lower in the former East Germany (0.46, t = 5.8), while by 2023–2025 that gap had essentially disappeared (0.01, which is effectively no different to zero). Given the East German population share of about 20%, the East German rise amounts to about 0.08 points for the German average. In that crowded section of the global rankings, that contribution covers about six ranks. ↩︎
In 2013 there was no significant difference between the male and female responses while in this report (with data only from 2023, with surveys not feasible in 2024 and 2025) the male life evaluations (1.63) are 30% higher than for females (1.26). This is the largest gender gap ever seen in our reports, where at the global level there is a slight advantage favouring females. ↩︎
Going from the larger to the smaller gains, these were Portugal, Iceland, Germany, and Finland. ↩︎
All with increases of 0.15 points or more on the 0–10 scale. ↩︎
All with drops of 0.11 or more on the 0–10 scale. ↩︎
The online statistical appendix contains alternative forms without year effects (Table 9) and a repeat version of the Table 2.1 equation showing the estimated year effects (Table 8). These results continue to confirm that inclusion of year effects makes no significant difference to any of the coefficients. In these aggregate equations, adding country fixed effects (as in Table 10) lowers the coefficients on relatively slowly moving variables where most of the variance is across countries rather than over time, such as healthy life expectancy. Our equations based on individual observations, where income and health are measured by individual-level variables, include both year and country fixed effects, with coefficients very similar to those estimated without fixed effects. ↩︎
The definitions of the variables are shown in Box 2.3, with additional detail in the online statistical appendix. ↩︎
The model’s predictive power is little changed if the year fixed effects in the model are removed, with adjusted R-squared falling only from 0.762 to 0.755. ↩︎
The data and rankings for the 2023–2025 averages for the six variables are to be found in Figures 22–39 of the online statistical appendix. The rankings for positive affect are in Figures 40–42, and for negative affect in Figures 43–45. The underlying annual data used in estimating the equations shown in Table 2.1 are currently not available on our website. At this time, we can only provide the data to researchers approved by Gallup. ↩︎
For example, unemployment responses at the individual level are available in most waves of the Gallup World Poll from 2009 onwards. While they show an effect size similar to that found in other research, the coefficient has never been significant in the country-level equation and their inclusion does not influence the size of the other coefficients. ↩︎
The main differences are a larger income effect, presumably flowing from the cyclical variations, higher coefficient on generosity, and the insignificance of the healthy life expectancy effect, probably due to its trend-like variation in most countries. ↩︎
Box 2.3 explains how these measures are constructed. ↩︎
Below, we use the term ‘effect’ when describing the coefficients in these regressions; some caveats to this interpretation are discussed later in this section. ↩︎
In the equation for negative affect, healthy life expectancy takes a significant positive coefficient, despite its positive simple correlation with life evaluations in this aggregate dataset. This may be due to the fact that in the global sample there is a positive correlation between age and the frequency of reports of negative emotions. Countries with higher healthy life expectancies have respondents who are older on average, since the sample data are weighted to replicate the actual age shares of the population. ↩︎
This influence may be direct, as many have found, e.g., De Neve et al. (2013). It may also embody the idea, as made explicit in Fredrickson’s broaden-and-build theory (Fredrickson, 2001), that good moods help to induce the sorts of positive connections that eventually provide the basis for better life evaluations. ↩︎
See, for example, the well-known study of the longevity of nuns, Danner et al. (2001). ↩︎
See Cohen et al. (2003) and Doyle et al. (2006). ↩︎
The meta-analysis by Chida and Steptoe (2008) shows significant linkages from positive affect to health, independent of the effects of negative affect. For a recent survey of the links running from positive emotions and life evaluations to subsequent morbidity and mortality, see Pressman et al. (2019). ↩︎
The prevalence of these feedbacks was documented in Chapter 4 of WHR 2013 (De Neve et al., 2013). ↩︎
For more detail, see Table 10 of the online statistical appendix for WHR 2018. We repeated the experiment this year, using data from 2017 to 2025, and confirmed the WHR 2018 findings. The latest results are shown in this year’s online statistical appendix, specifically Table 11 that includes year fixed effects, and Table 12 that has both year fixed effects and country fixed effects. ↩︎
We expected the coefficients on these variables (but not on the variables based on non-survey sources) to be reduced to the extent that idiosyncratic differences among respondents tend to produce a positive correlation between the four survey-based factors and the life evaluations given by the same respondents. This line of possible influence is cut when the life evaluations are coming from an entirely different set of respondents than are the four social variables. The fact that the coefficients are reduced, but only very slightly, suggests that the common-source link is real but very limited in its impact. ↩︎
The income coefficient increases slightly since income is positively correlated with the other four variables being tested, so that income is now able to pick up a fraction of the drop in influence from the other four variables. We performed an additional test this year, using a specification that includes both year fixed effects and country fixed effects (our main specifications include year fixed effects only). Table 10 and Table 12 in the online appendix show the comparisons. Again, changes in estimated coefficients are small, with the biggest being the reduction in the effect of social support from 2.559 to 2.255, a 12% reduction that has borderline statistical significance. Again, we observe a slight increase in the effect of income per capita, and reductions in three of the other four factors. The only coefficient that increases in size is the effect of generosity, rising in magnitude by about 4%. ↩︎
Actual and predicted national and regional average 2023–2025 life evaluations are plotted in Figure 49 of the online statistical appendix. The 45-degree line in each part of the figure shows a situation where the actual and predicted values are equal. A predominance of country dots below the 45-degree line shows a region where actual values are below those predicted by the model, and vice versa. The Middle East and North Africa region provides a slight example of the former case, and Latin America is an extreme case of the latter. ↩︎
See Rojas (2018). ↩︎
If special variables for Latin America and Southeast Asia are added to the equation in column 1 of Table 2.1, the Latin American coefficient is +0.50 (t = 5.2) and that for Southeast Asia is -0.30 (t = 2.1). Special variables for East Asia and South Asia are not significant. ↩︎
See Chen et al. (1995) for differences in response style, and Chapter 6 of WHR 2022 for data on regional differences in variables thought to be of special importance in Asian cultures. ↩︎
One slight exception is that the negative effect of corruption is estimated to be slightly larger (0.87 rather than 0.73), although not significantly so, if we include a separate regional variable for Latin America. This is because perceived corruption is worse than average in Latin America and its happiness effects there are offset by stronger close-knit social networks, as described in Rojas (2018). The inclusion of a special Latin American variable thereby permits the corruption coefficient to take a higher value. ↩︎
This definition is informed by panel reports from the American Psychological Association (APA, 2023) and the National Academies of Sciences, Engineering, and Medicine (Galea & Buckley, 2024). ↩︎
The first wave of the survey was divided between 2005 and 2006. ↩︎
Weighting by population tends to make each region represent mainly what is happening in the largest countries. The differences between the weighted and unweighted trends are analysed in Chapter 2 of WHR 2019. Population-weighted averages of average life evaluations by age group in WHR 2015 showed the youngest age group to be the happiest for the world as a whole, and for each global region. That same pattern is replicated for one-country one-vote data shown in Figure 2.2 for the 2006–2011 period. In the population-weighted data in WHR 2015, there was an apparent U-shape in age (where life evaluations are higher for the old and the young than for the middle age groups) only in the NANZ group of countries and in East Asia. ↩︎
For reviews on children and adolescents, see OECD reports (2025a, 2025b, and 2025c), and especially OECD (2025b). For specific studies on children and adolescents see, for instance Boniel-Nissim et al. (2022), Keles et al. (2020), Orben et al. (2019), Thorisdottir et al. (2019), and Twenge et al. (2022). For research on emerging adults and older, see Coyne et al. (2020), Gaia et al. (2021), Jarman et al. (2023), Martingano et al. (2022), Shakya and Christakis (2017), Vannucci et al. (2017), and Vuorre and Przybylski (2023). ↩︎
See Figure 3.6 in Fortin et al. (2015). ↩︎
See Figure 3.8, Panel 6 in Fortin et al. (2015). ↩︎
Although much social media research, including that in several chapters of this report, deals with adolescents, the Gallup World Poll data are limited to those 15 and over. The PISA survey we employ later covers a one-year range with an average age of 15.75 years. ↩︎
This question was asked as part of the Gallup/Meta State of Social Connections study. ↩︎
In the sample of data used for this figure, about 20% of the countries, and 35% of the total sample of those under 25 years of age, are in Sub-Saharan Africa, giving that region a large influence on the global panel. ↩︎
Facebook came out in 2008, and had 600 million users by the end of 2010. Instagram was launched in October 2010 for Apple IOS only, and had 30 million users in April 2012 when it was acquired by Facebook and made available on Android in that same month. By the end of 2012 it was estimated to have 100 million users, and Facebook 1 billion. By the end of 2015, Facebook had about 1.6 billion users, and Instagram 400 million. ↩︎
However, for the NANZ countries, and for Western Europe, the worry change is actually larger when the years 2020–2022 are removed from the recent comparison group. ↩︎
Some reviewers have suggested that this result may be a consequence of universally high, and hence uninformative, internet access in the richer countries, with our netphone variable capturing the generally higher levels of economic development elsewhere, and the already demonstrated low youth happiness in NANZ. These are indeed possibilities worth checking. Including one variable denoting an individual aged <25, and another the log of GDP per capita to reflect the national level of development did not change any of the netphone coefficients materially, and shown in Table 14 of the online statistical appendix. ↩︎
For the global sample of slightly more than 200,000 post-2016 respondents under the age of 25, the simple correlations between netphone and log income and college education are +0.42 and +0.25. For social30, with roughly 23,000 respondents <25 years in 2022, the corresponding correlations are very similar, at +0.40 and +0.13. ↩︎
The sampling is based on age, with a minimum of 15 years and 3 months and a maximum of 16 years 2 months, with a fairly uniform sampling between those boundaries. The average age is 15.75 years. ↩︎
It should be noted that past research on trajectories of life satisfaction suggests boys have an advantage around the age of 15. However, girls close this gap, and can even have higher life satisfaction, as they approach 23–24 years old, see Gestsdottir et al. (2015), Henkens et al. (2022), Marquez et al. (2024), and Orben et al. (2022). ↩︎
See Huang et al. (2025). ↩︎
This variable is the simple average of the following six questions: During the past week, did you __: feel you could not shake off the sadness? have trouble concentrating on what you were doing? feel depressed? feel that everything you did was an effort? not sleep well? feel sad? The response scale (treated as cardinal in a 0 to 3 range) is: Rarely or never (less than 1 day), Some or a little of the time (1-2 days), A considerable amount of time (3-4 days), All of the time or most of the time (5-7 days). ↩︎
The SC and AC coefficients are 0.068 and 0.028 for females (p = .0021 for the difference), while being 0.075 and 0.023 for males (p = .0001). ↩︎
The SC and AC coefficients for the young are 0.054 and 0.005 (p = .018 for the difference), and 0>069 and .028 for those 25 and older (p = .0002 for the difference). ↩︎
For young women, the coefficients are 0.050 and 0.013 (p = .189 for the difference) and 0.051 and -0.002 for young men (p = .079 for the difference). The smaller sample sizes are responsible for the decline in p-values in these cases. ↩︎
A Wald test of the difference between the SC and AC coefficients is significant (p = .018). ↩︎
It has been argued that lack of internet access (Hargittai & Hinnant, 2008), and unequal access to social media (Büchi & Hargittai, 2022) would increase wellbeing inequality among the young. However, for the PISA respondents, those without internet access have life satisfaction not far below those with some social media use, and, at least for girls, higher life satisfaction than among the heaviest social media users. Although we have tracked increasing within-country wellbeing inequality, the increases appear no greater among the young than their elders, thus limiting the possible role for social media as a driver of wellbeing inequality. ↩︎
See Huang et al. (2025) for further evidence on the much larger drops in Canada and the United States. ↩︎
Przbylski and Weinstein (2017) proposed the hypothesis and tested it with UK data. Brannigan et al. (2022) provided confirmation using Irish data. Most recently, Singh et al. (2026) used Australian data, while Nennistiel and Ulrich (2026) used an OECD sub-sample of the PISA data analysed in this report. ↩︎